immunization summary
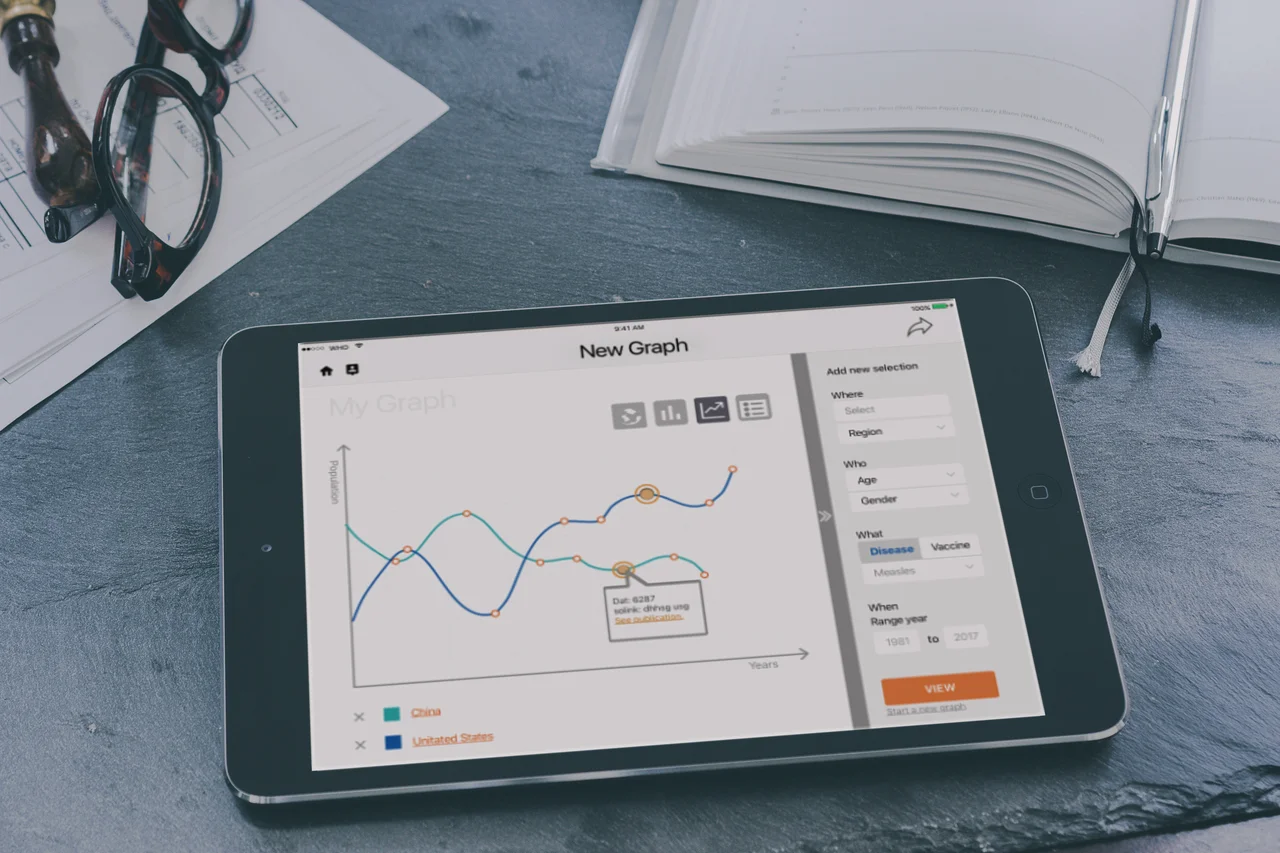
context
Data Visualization Optimized for Tablet
Immunization Summary is an app put out by the World Health Organization in conjuncture with UNICEF, and is a collection of the WHO’s data and is used as a reference for immunization preventable disease and the effectiveness of vaccines across the globe.
The app is intended for visualizing international vaccination statistics in the form of graphs, maps, and tables. Publications on this data, along with policies, activities, and the impact of national immunization systems is also accessible in the app. The Immunization Summary app is available for free in The App Store.
overview
Goal
Redesign the World Health Organization’s Immunization Summary app, optimizing the app for a mobile device, (i.e. cell phone or tablet). The designs should be testable, and iterations made based on user feedback.
My role
Project Manager
Information Architect
Process Documenter
Tools
Immunization Summary App
OmniGraffle®
time frame
Two weeks
my deliverables
New App Sitemap and Navigation
Sprint Schedule
Project Scope
Team deliverables
low fi Prototype
Wireframes (page layouts)
New App Sitemap
Persona Creation
Research Analytics
Challenge
The WHO together with UNICEF collects data on vaccine preventable diseases and would like to make this information easily accessible to the public via mobil App. The current App lacks a related brand icon, interactive features, and visual appeal. The redesigned app needs have clear branding referencing the WHO, easy navigation, and include an interactive feature.
The biggest challenge will be understanding who would access this data via an mobile device when they could just as easily open a laptop and reference the WHO’s website.
problem statement
The Immunization Summary App suffers from a confusing icon, app layout, and navigation that is neither intuitive nor optimized for mobile device; preventing the user from easily refferencing the supplied data.
solution statement
By redesigning the app to visually communicate the app’s purpose and value, implementing a more intuitive user flow, and interactive features; users will be more inclined to engage the app to inform, demonstrate, and learn about global health data and the WHO’s brand.
Process
ID Users
Identify the potential downloaders of this app.Research the Problem
Research the analytics available on the App Store's site page.
Conduct interviews with the app's potential users.Organize the Information and Design the Solution
Develop a solution to the apps branding and UI issues by renaming the app to reflect the World Health Organization's affiliation.
Redesign the icon.
Add an interactive feature and improved UI to the existing graph.Prototype and Test the Solution
Design and test a low-fi paper prototype and a hi-fi prototype using inVision.
Test the new interactive feature and app navigation with medical research participants.Iterate on the design
Make iterations based on user feedback to improve the apps accessibility.
deep dive
research
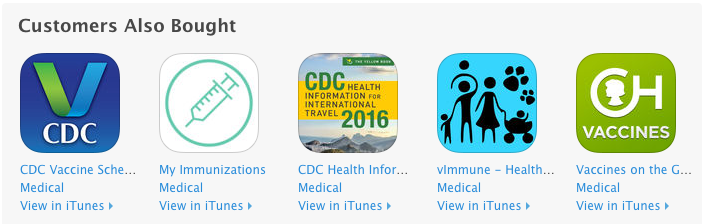
Q 1: Who is downloading this app?
A 1: Parents
According to the App Store analytics, most users who had downloaded the app were looking for vaccination schedules; not a statistical app with graphing features.
Q 2: Why is there a brand disconnect?
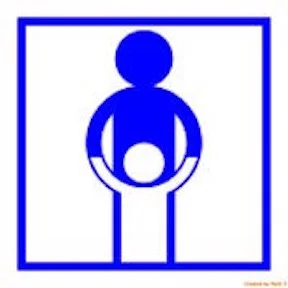
Immunization Summary App Store Icon
A 2: The branding message of the icon is incongruent with the app’s purpose.
The current icon for the app projects the message of child care more than global health statistics; or graphs, or charts, or any of the apps core features. There were no reviews for the app from users, and it was grouped with other apps that were for tracking a child’s immunizations, and immunization schedules for other countries.
Q 3. Why is the app so difficult to navigate?
A 3: Repetitive information architecture, resulting in an arduous user flow experience.
The app’s information architecture also differs from tablet to cell phone, is very complex, and lacks visual appeal.
To understand how to transform this app, I broke down our business and potential user goals as follows:
User Goals:
Access global health information
Understand global health trends simply and visually
Export and share Assets like graphs
Portability
Business Goals:
Promote the WHO's brand as a leading authority on global research
Improving global health
Educate people about global health issues
Provide easy access to global health data
Information Architecture
User testing of the site was preformed on professional medical researchers to test out the features our primary persona would want. Testing for the secondary user was done on students/learners.
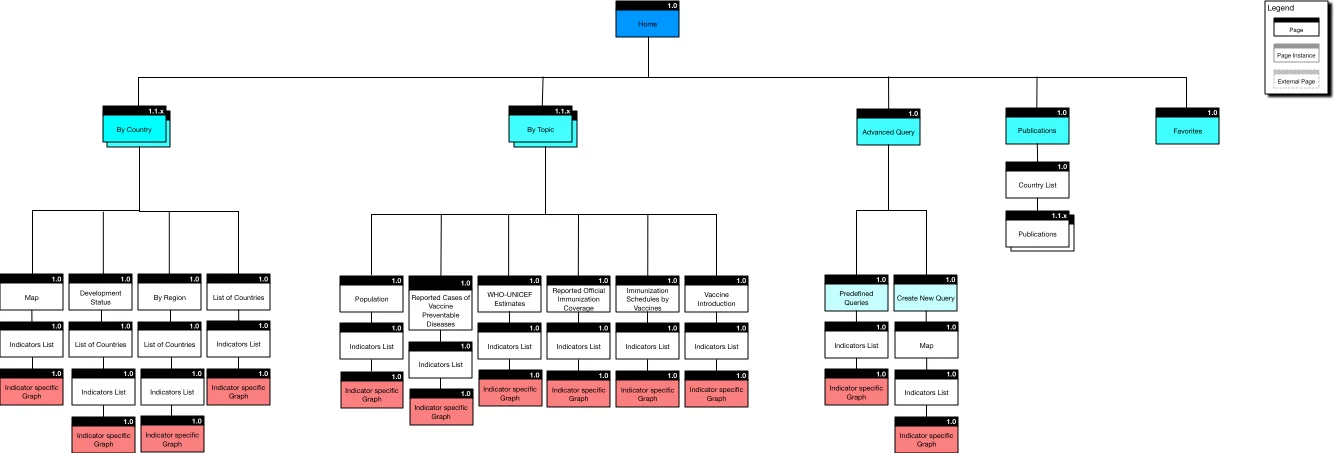
The original site map was very confusing for users. When the user entered the app there were five different primary navigation options and two sub-navigation options.
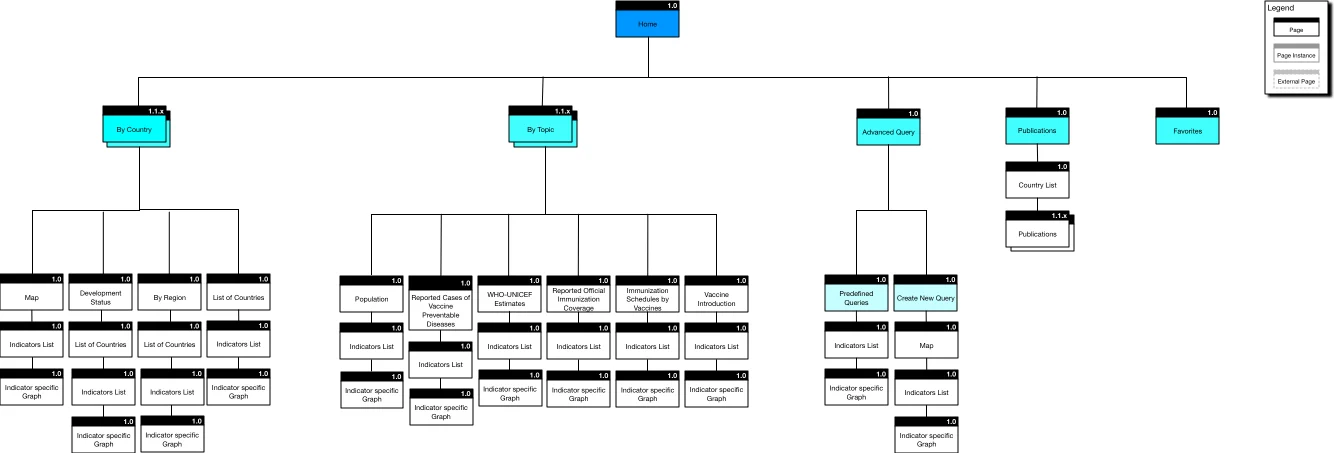
To reach a graphic representation of any information within the app, the user needed to go through three to four screens, indicating which selectors they wanted before the graph was produced as represented by the screens in red:
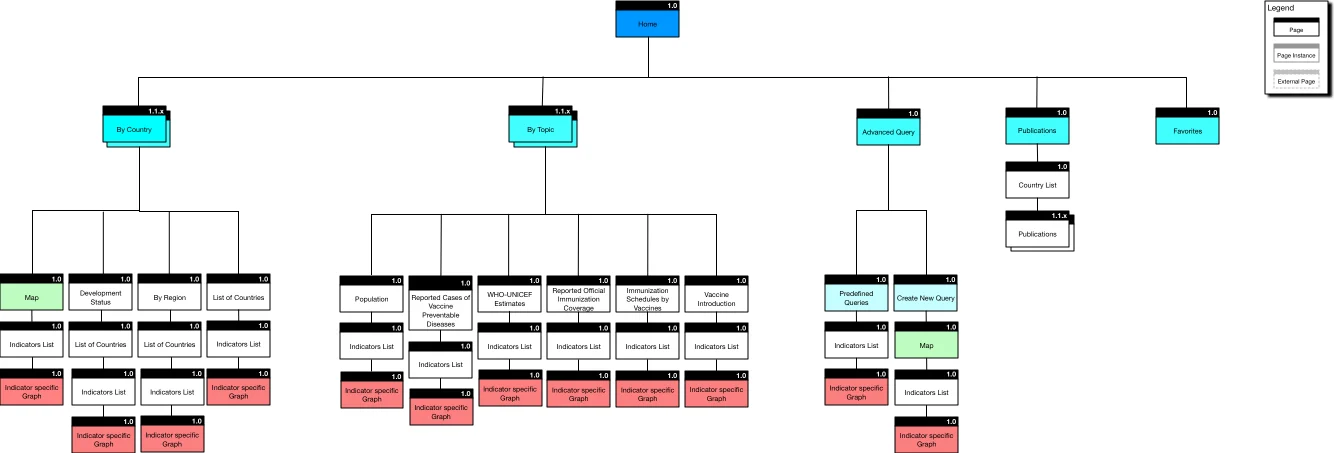
The only interactive parts of the original app were the map screens as shown here in green:
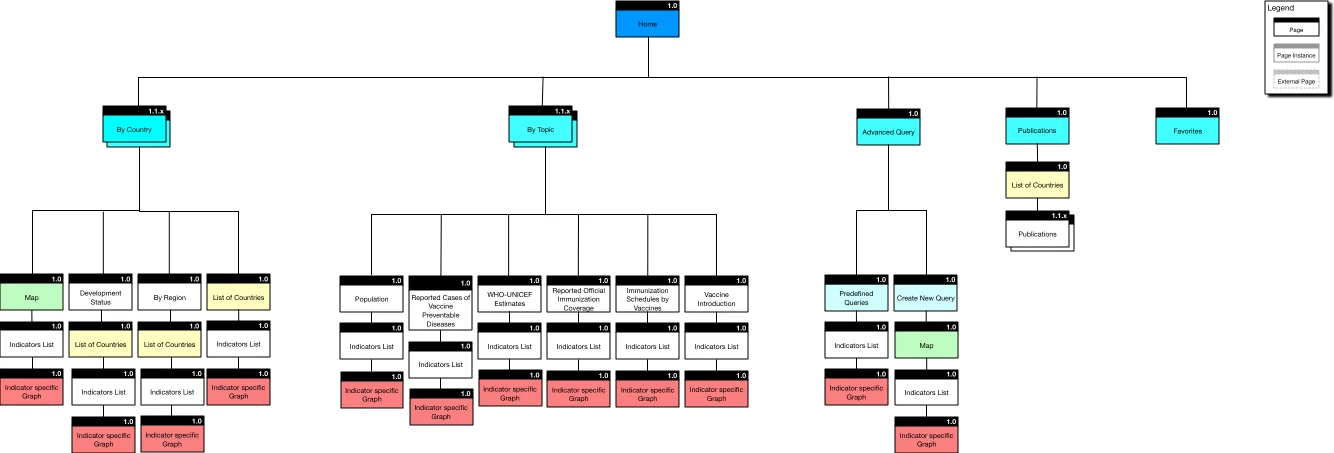
The countries were listed in alphabetical order on several pages of the app as seen in yellow:
Their indicators were separated out across several screens that users needed to navigate through, as shown in peach, and a publications page, purple:
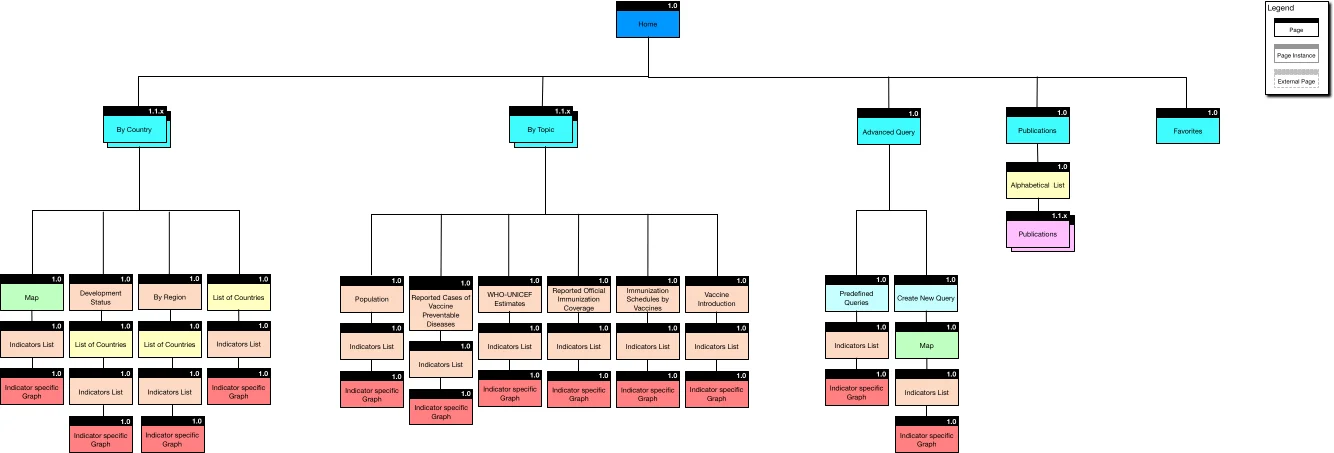
While navigating through the app, the user would go through a minimum of three different steps, or pages (sometimes four) before producing a graph. The user would also land on the same page multiple times throughout the app, depending on the chosen route. The app needed a more intuitive route to the graph view.
New Sitemap
To achieve the final goal, I converted the site map structure into two main navigation options.
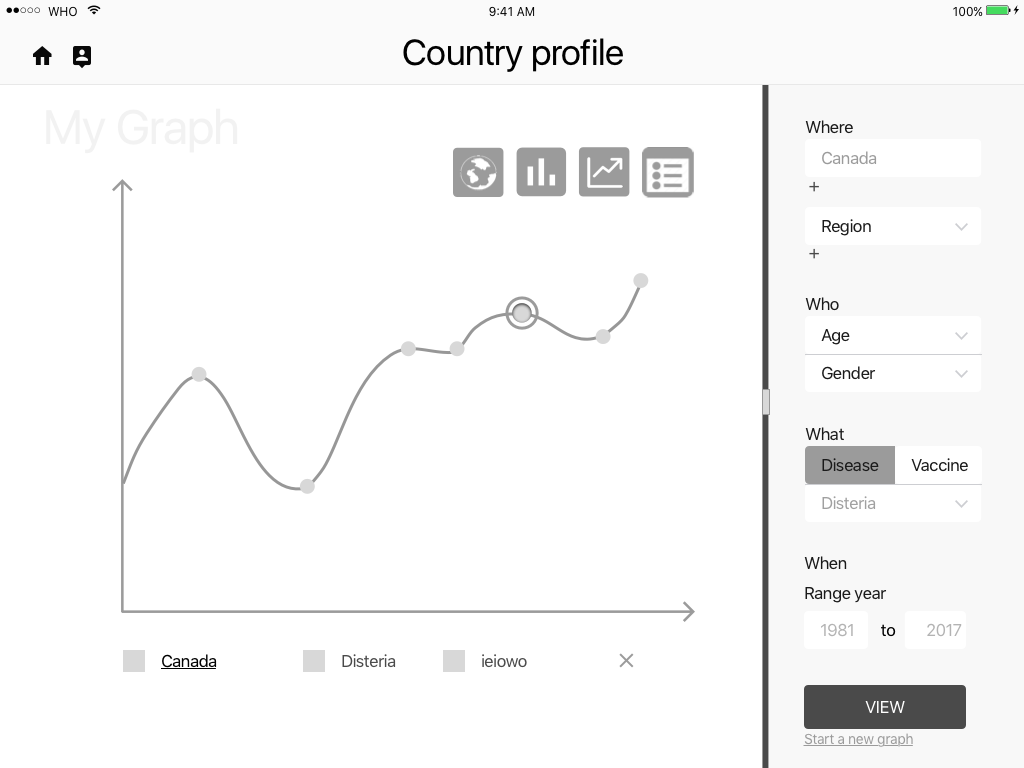
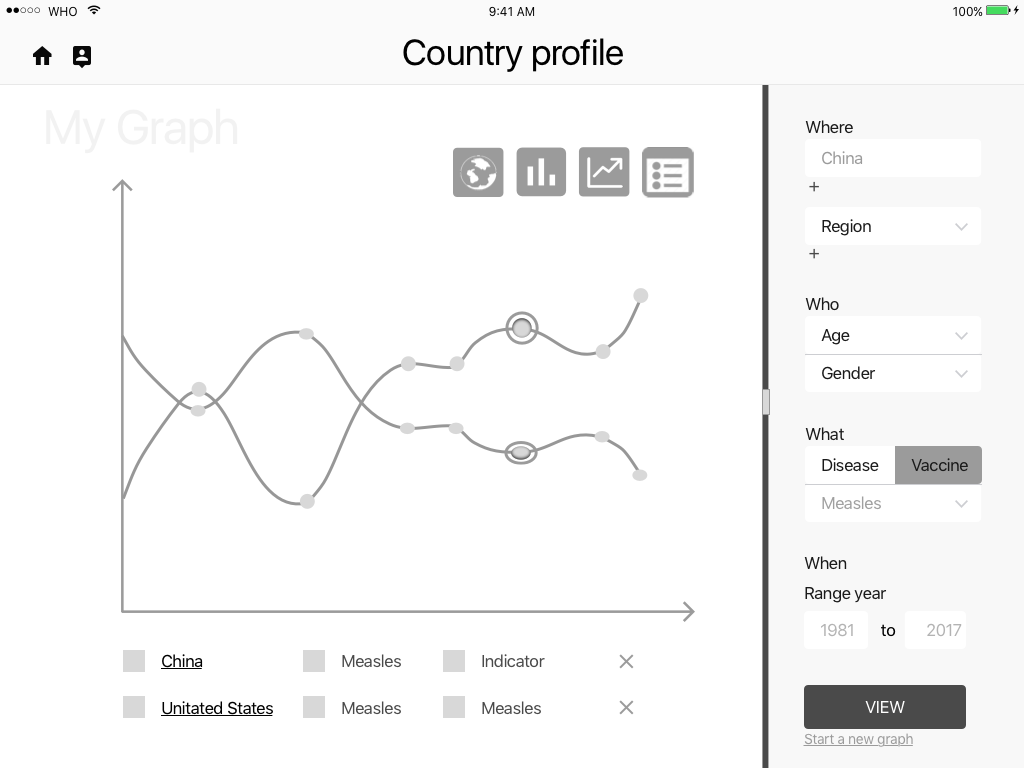
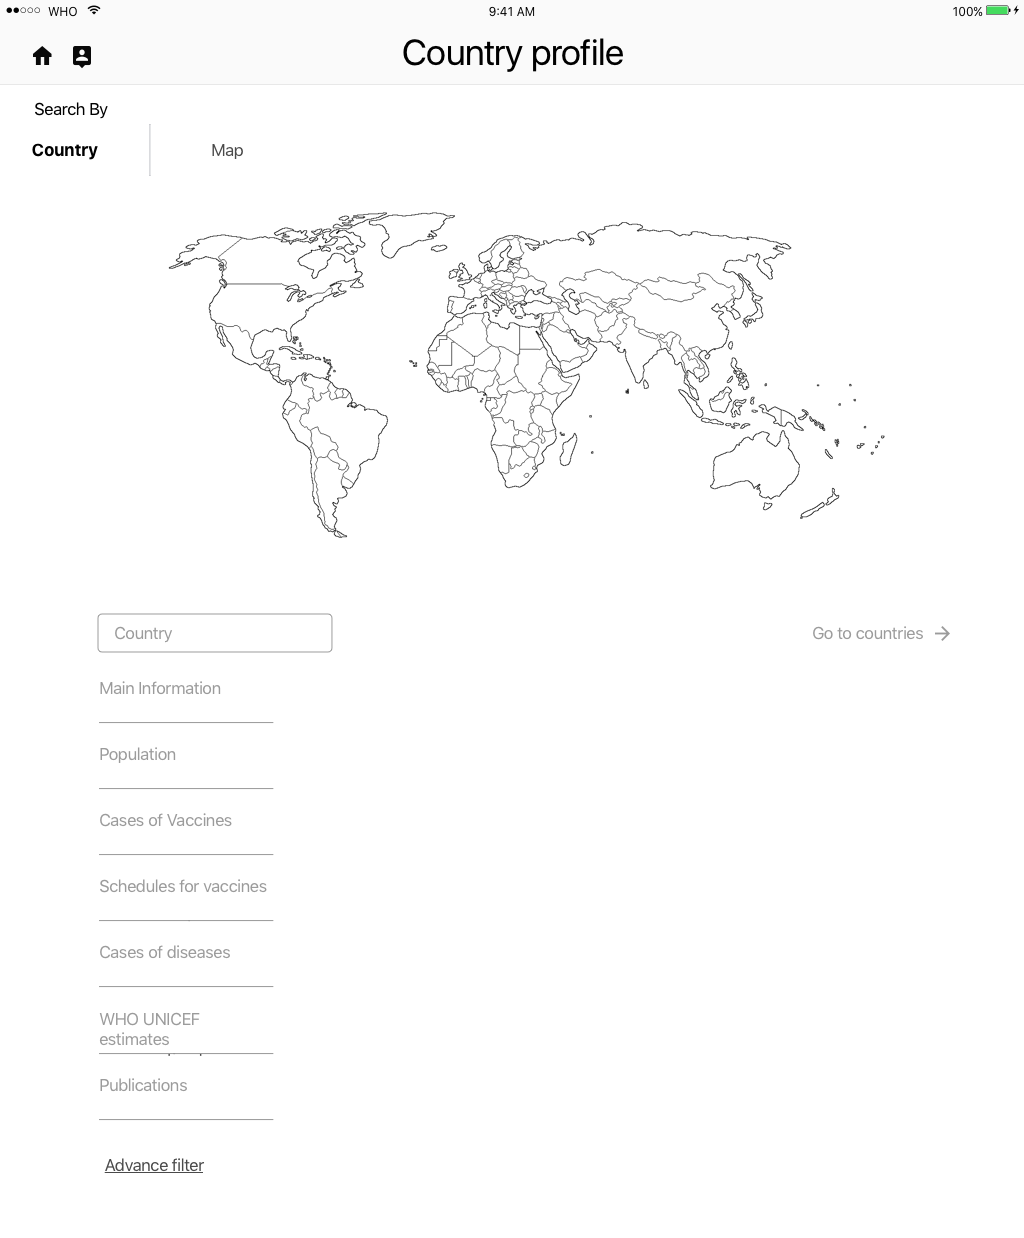
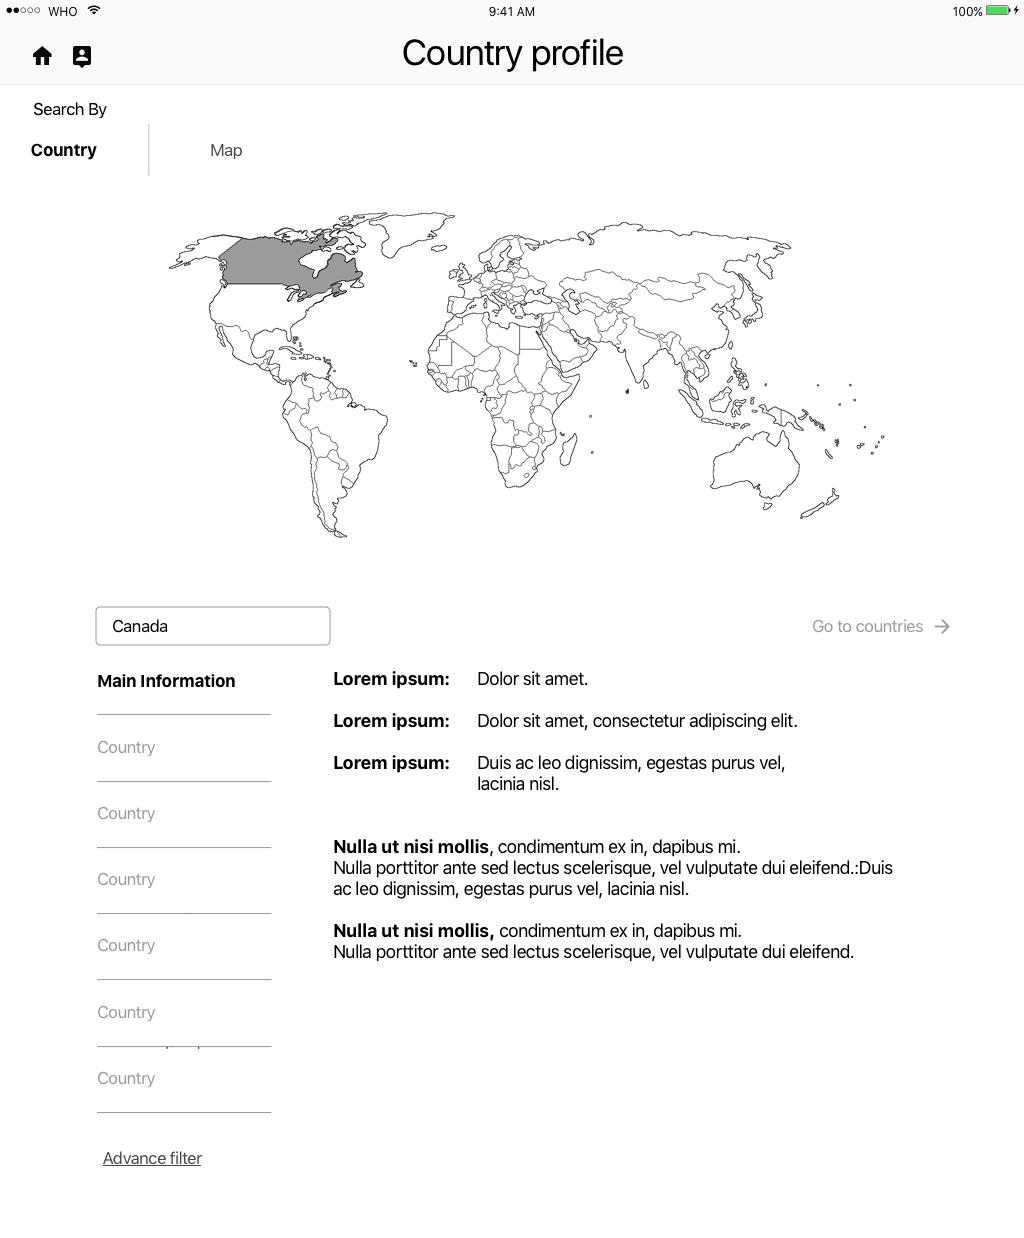
This allowed users to see all the stats on a selected country in one page, or produce a new graph by selecting specific indicators, which then takes them to a beautiful interactive graph.
The user can now also compare data across countries and add additional countries, and or indicators.
As indicated by the colors, none of the original navigation options were removed. They were all condensed into two easy to navigate screen options.
Design
The apps new name and icon were produced using a “Design Studio” method. This involved a very rapid create, pitch, critique outline. The entire process took less than 15 minutes, including discussion time and deciding on a final logo and app name.
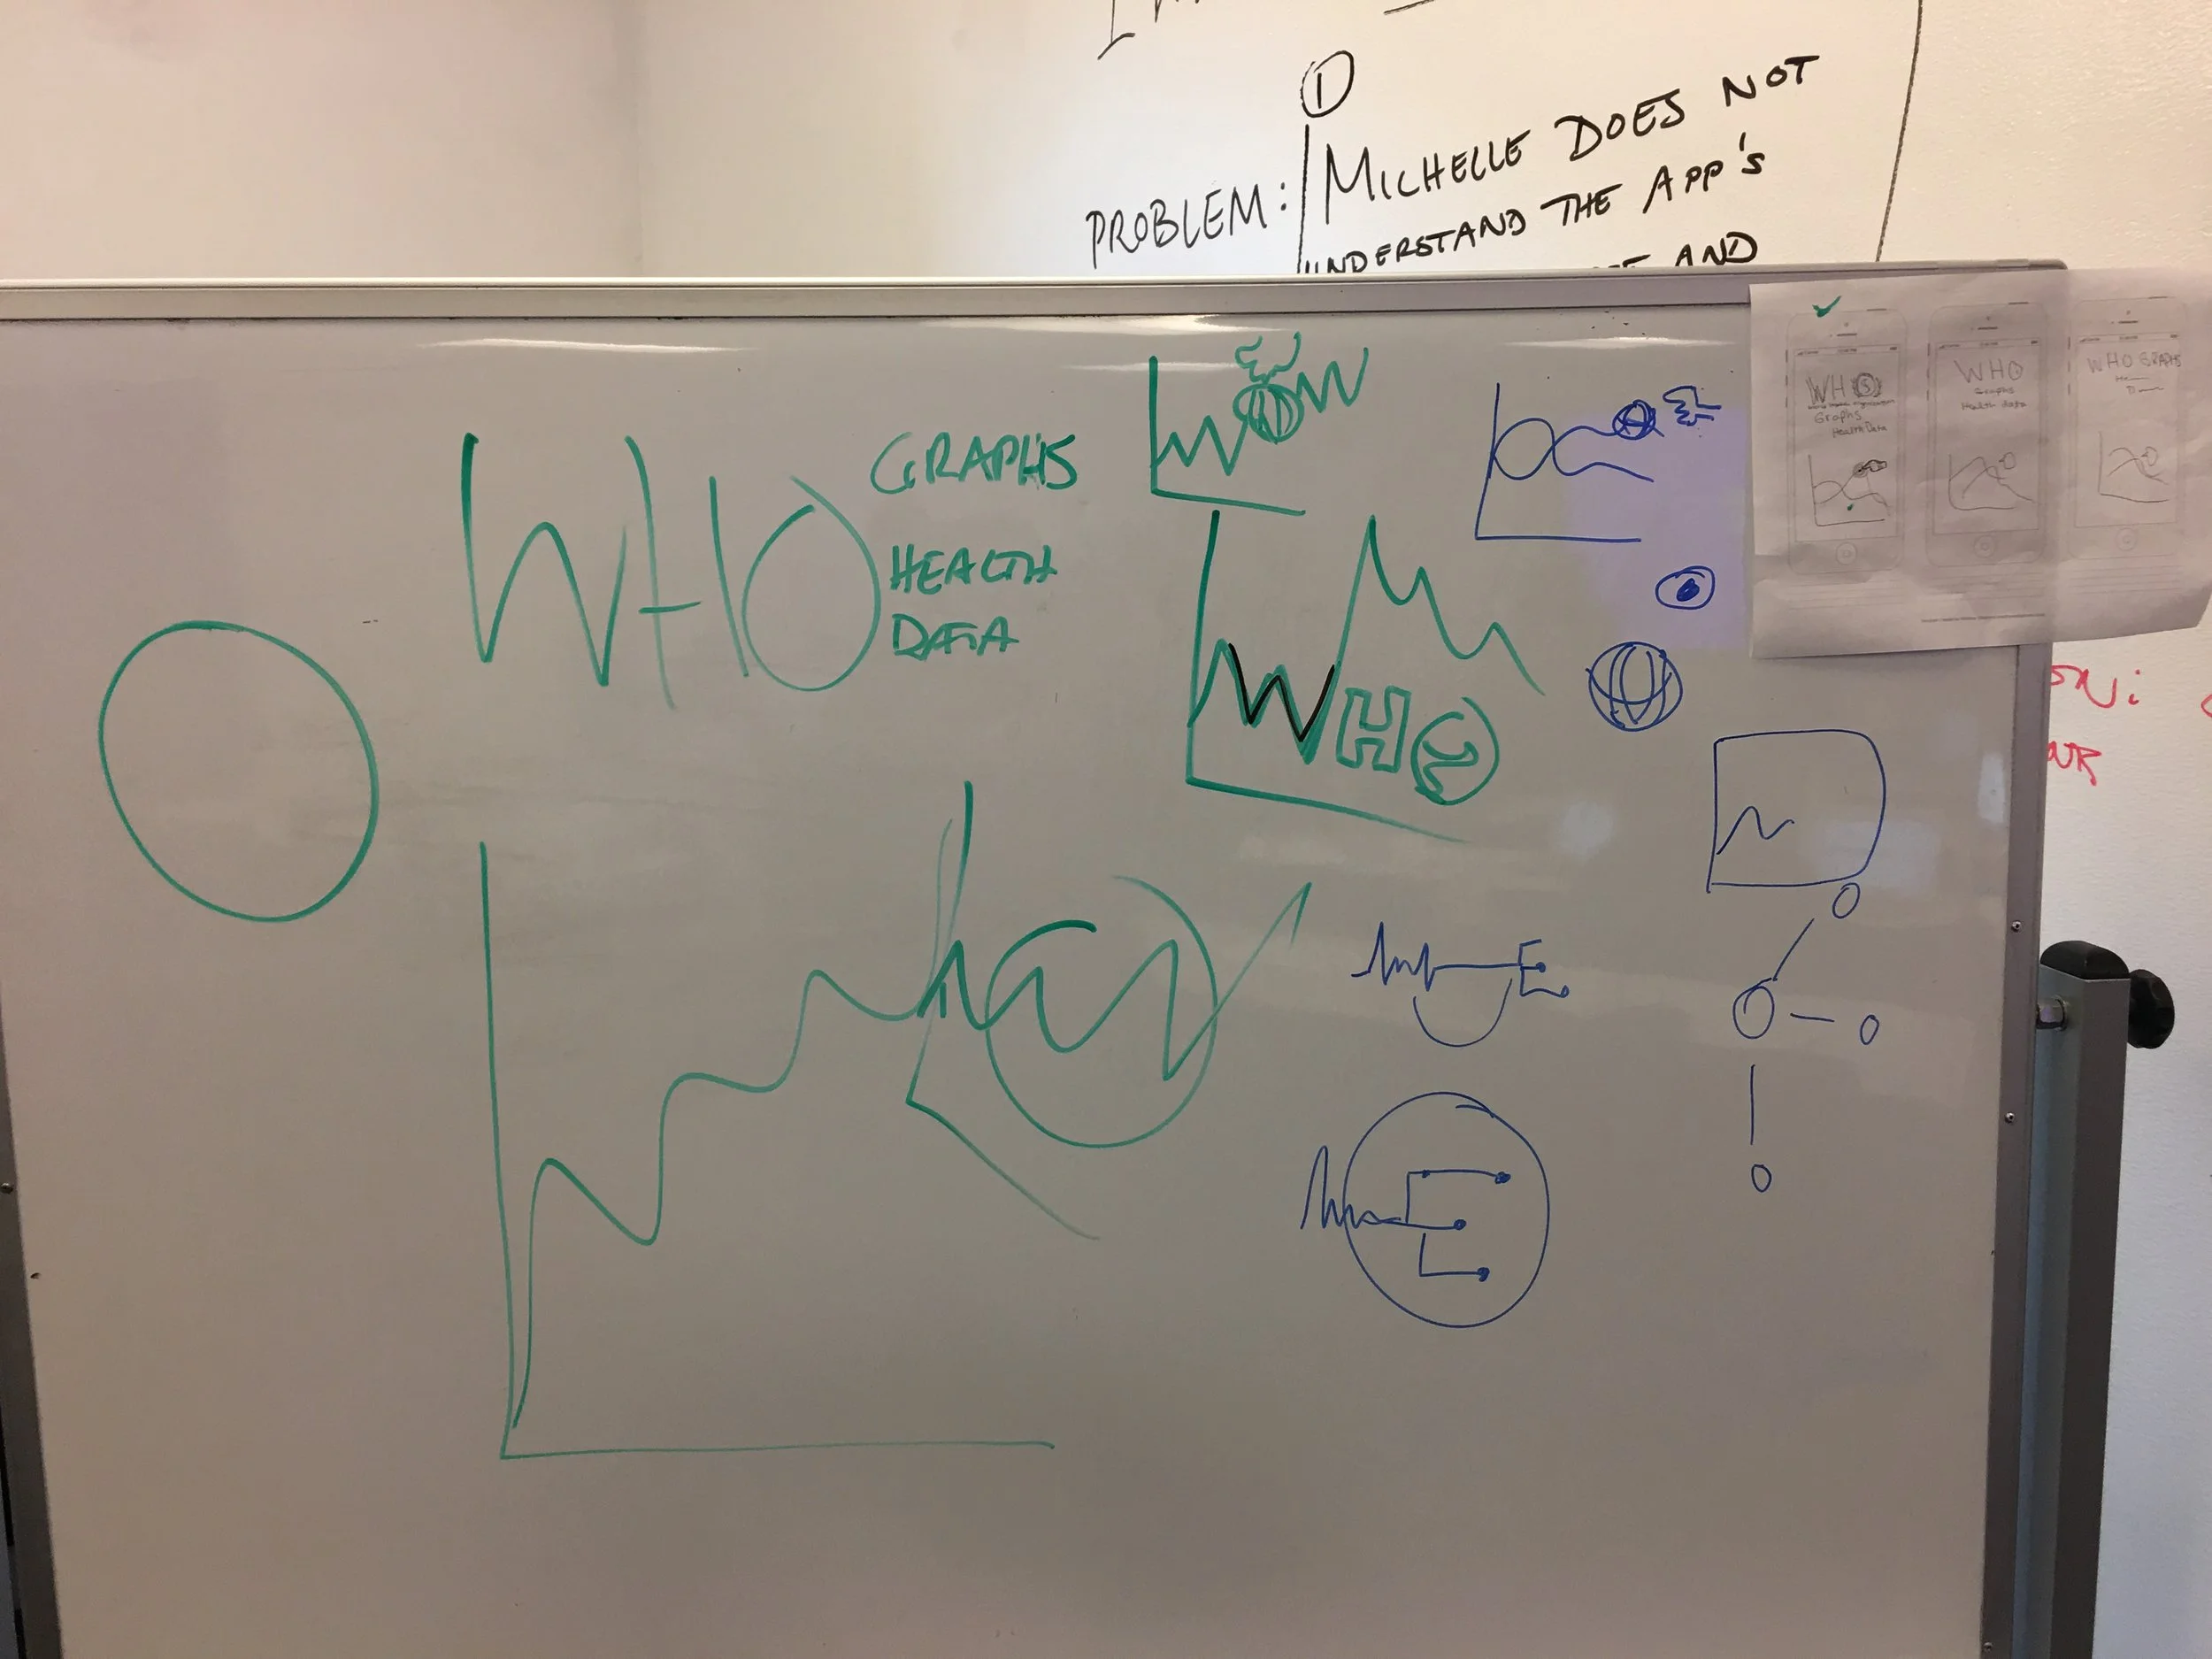
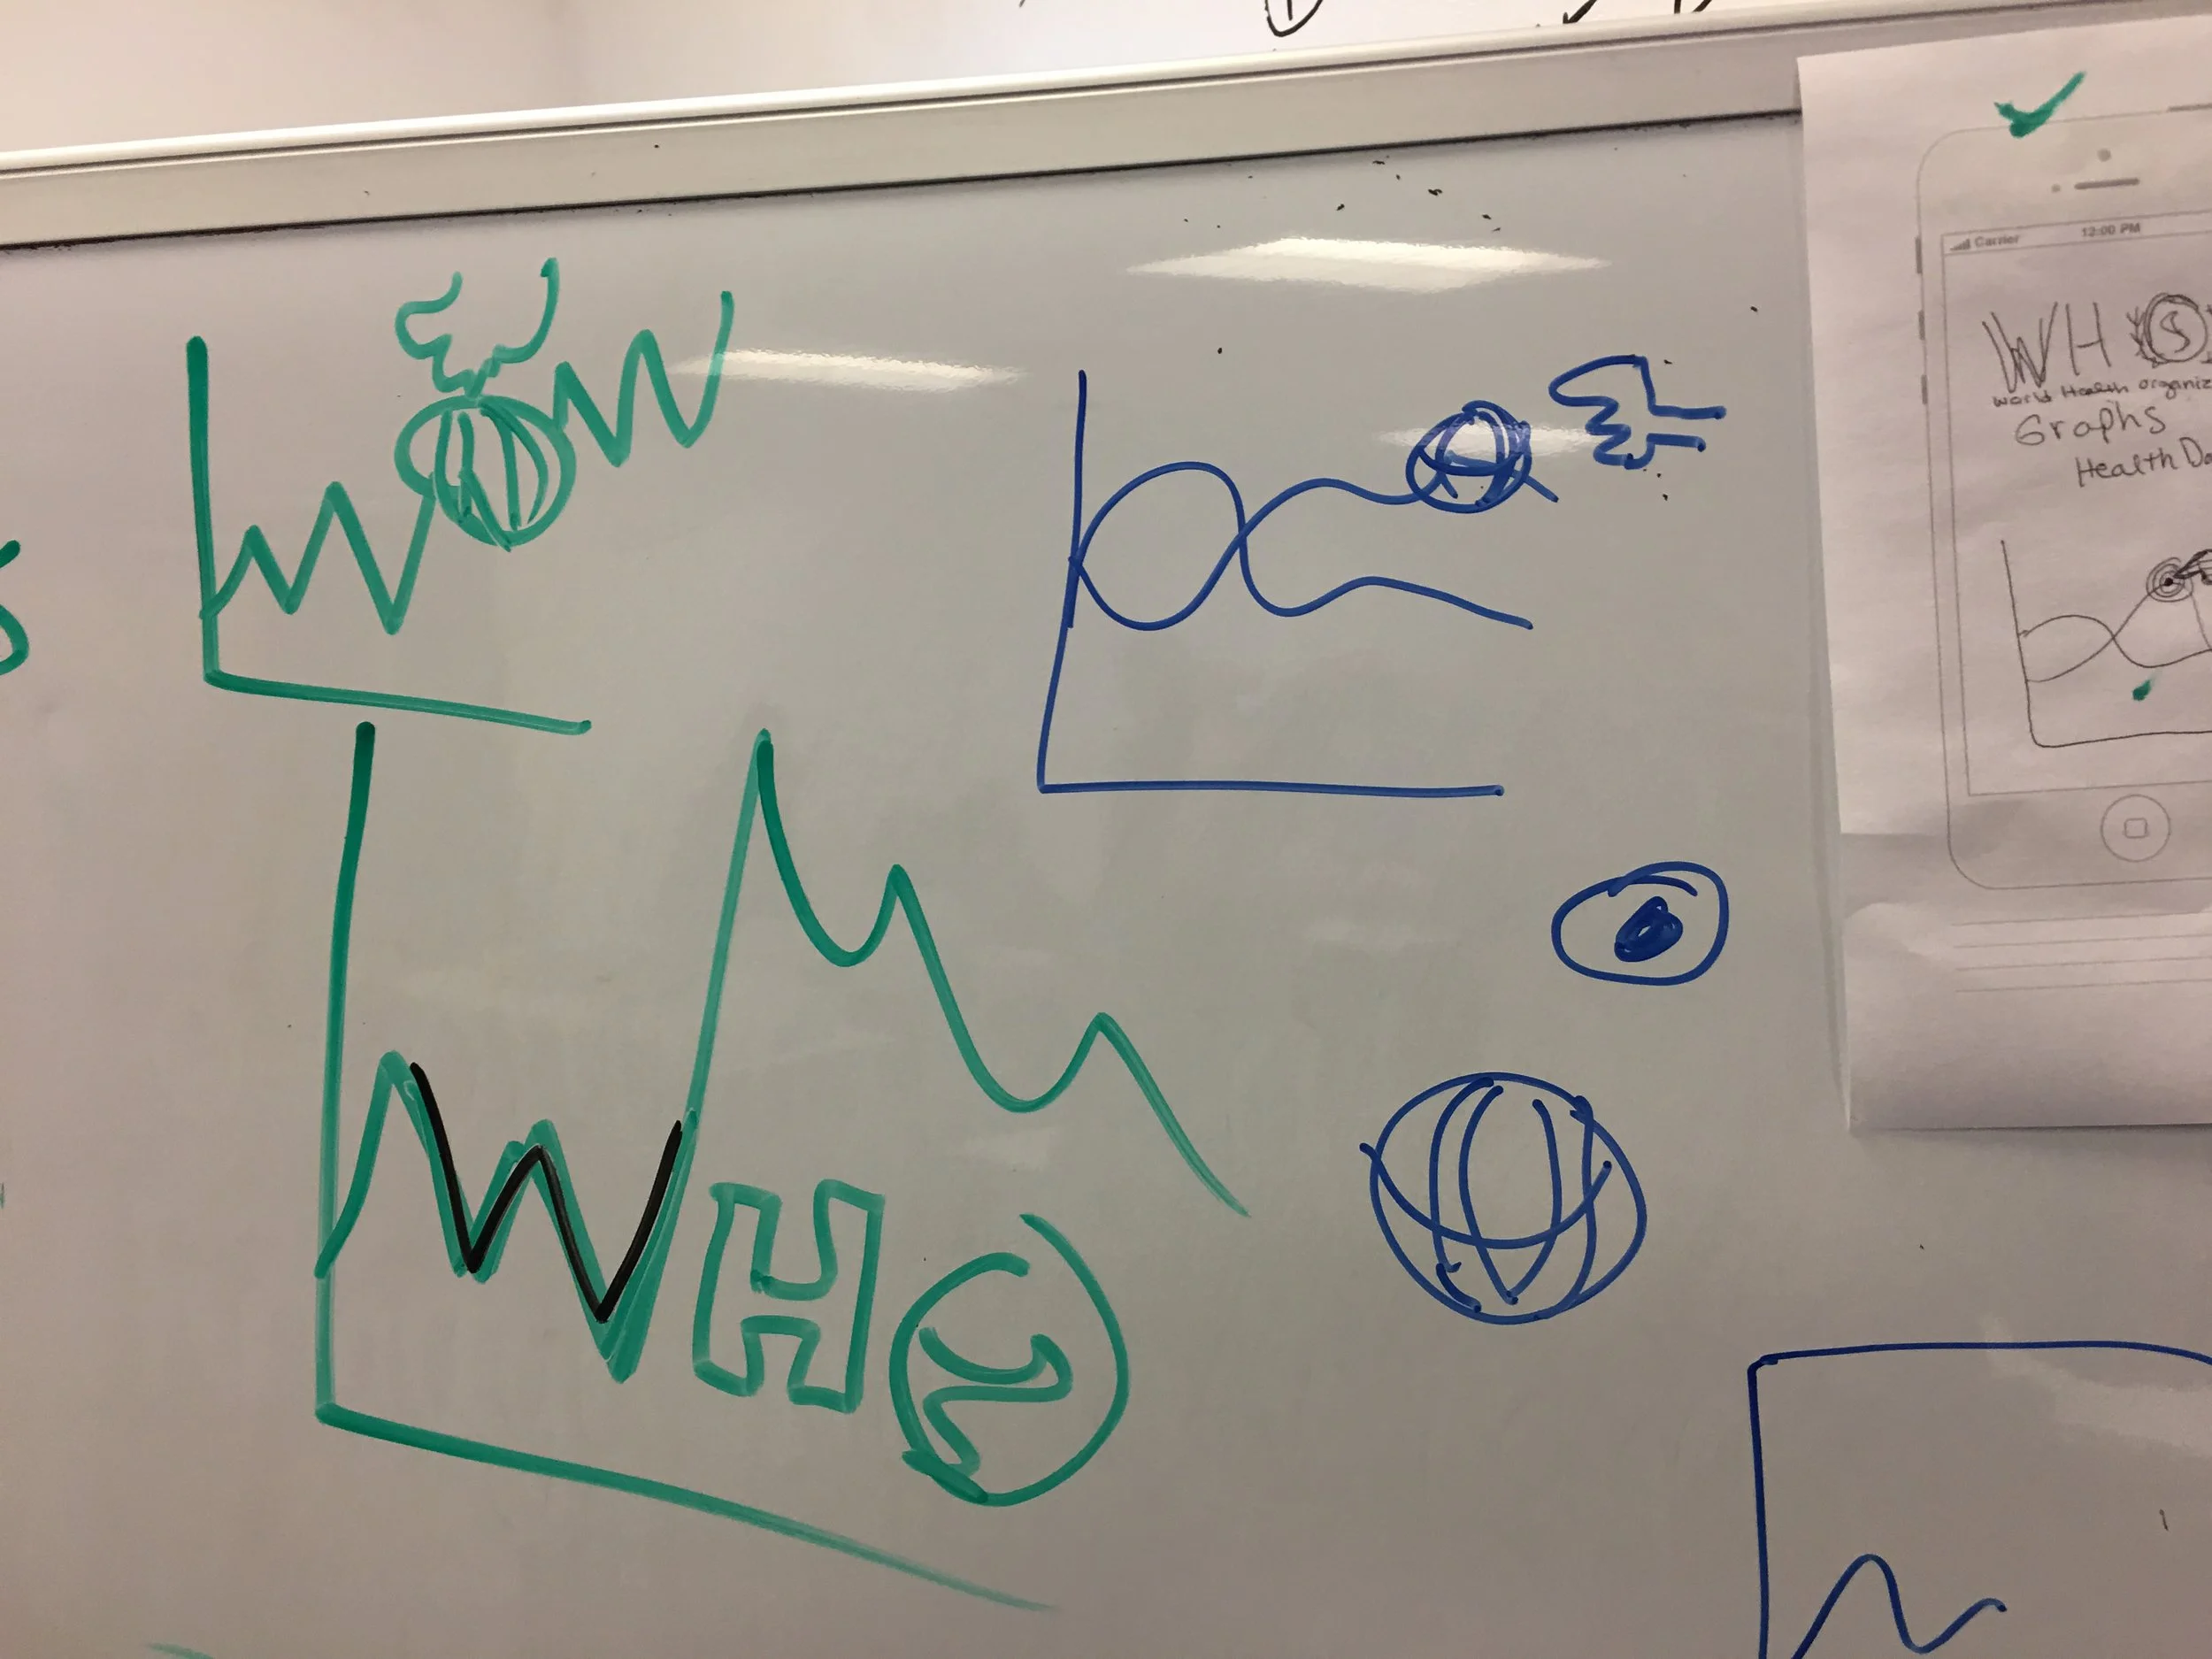
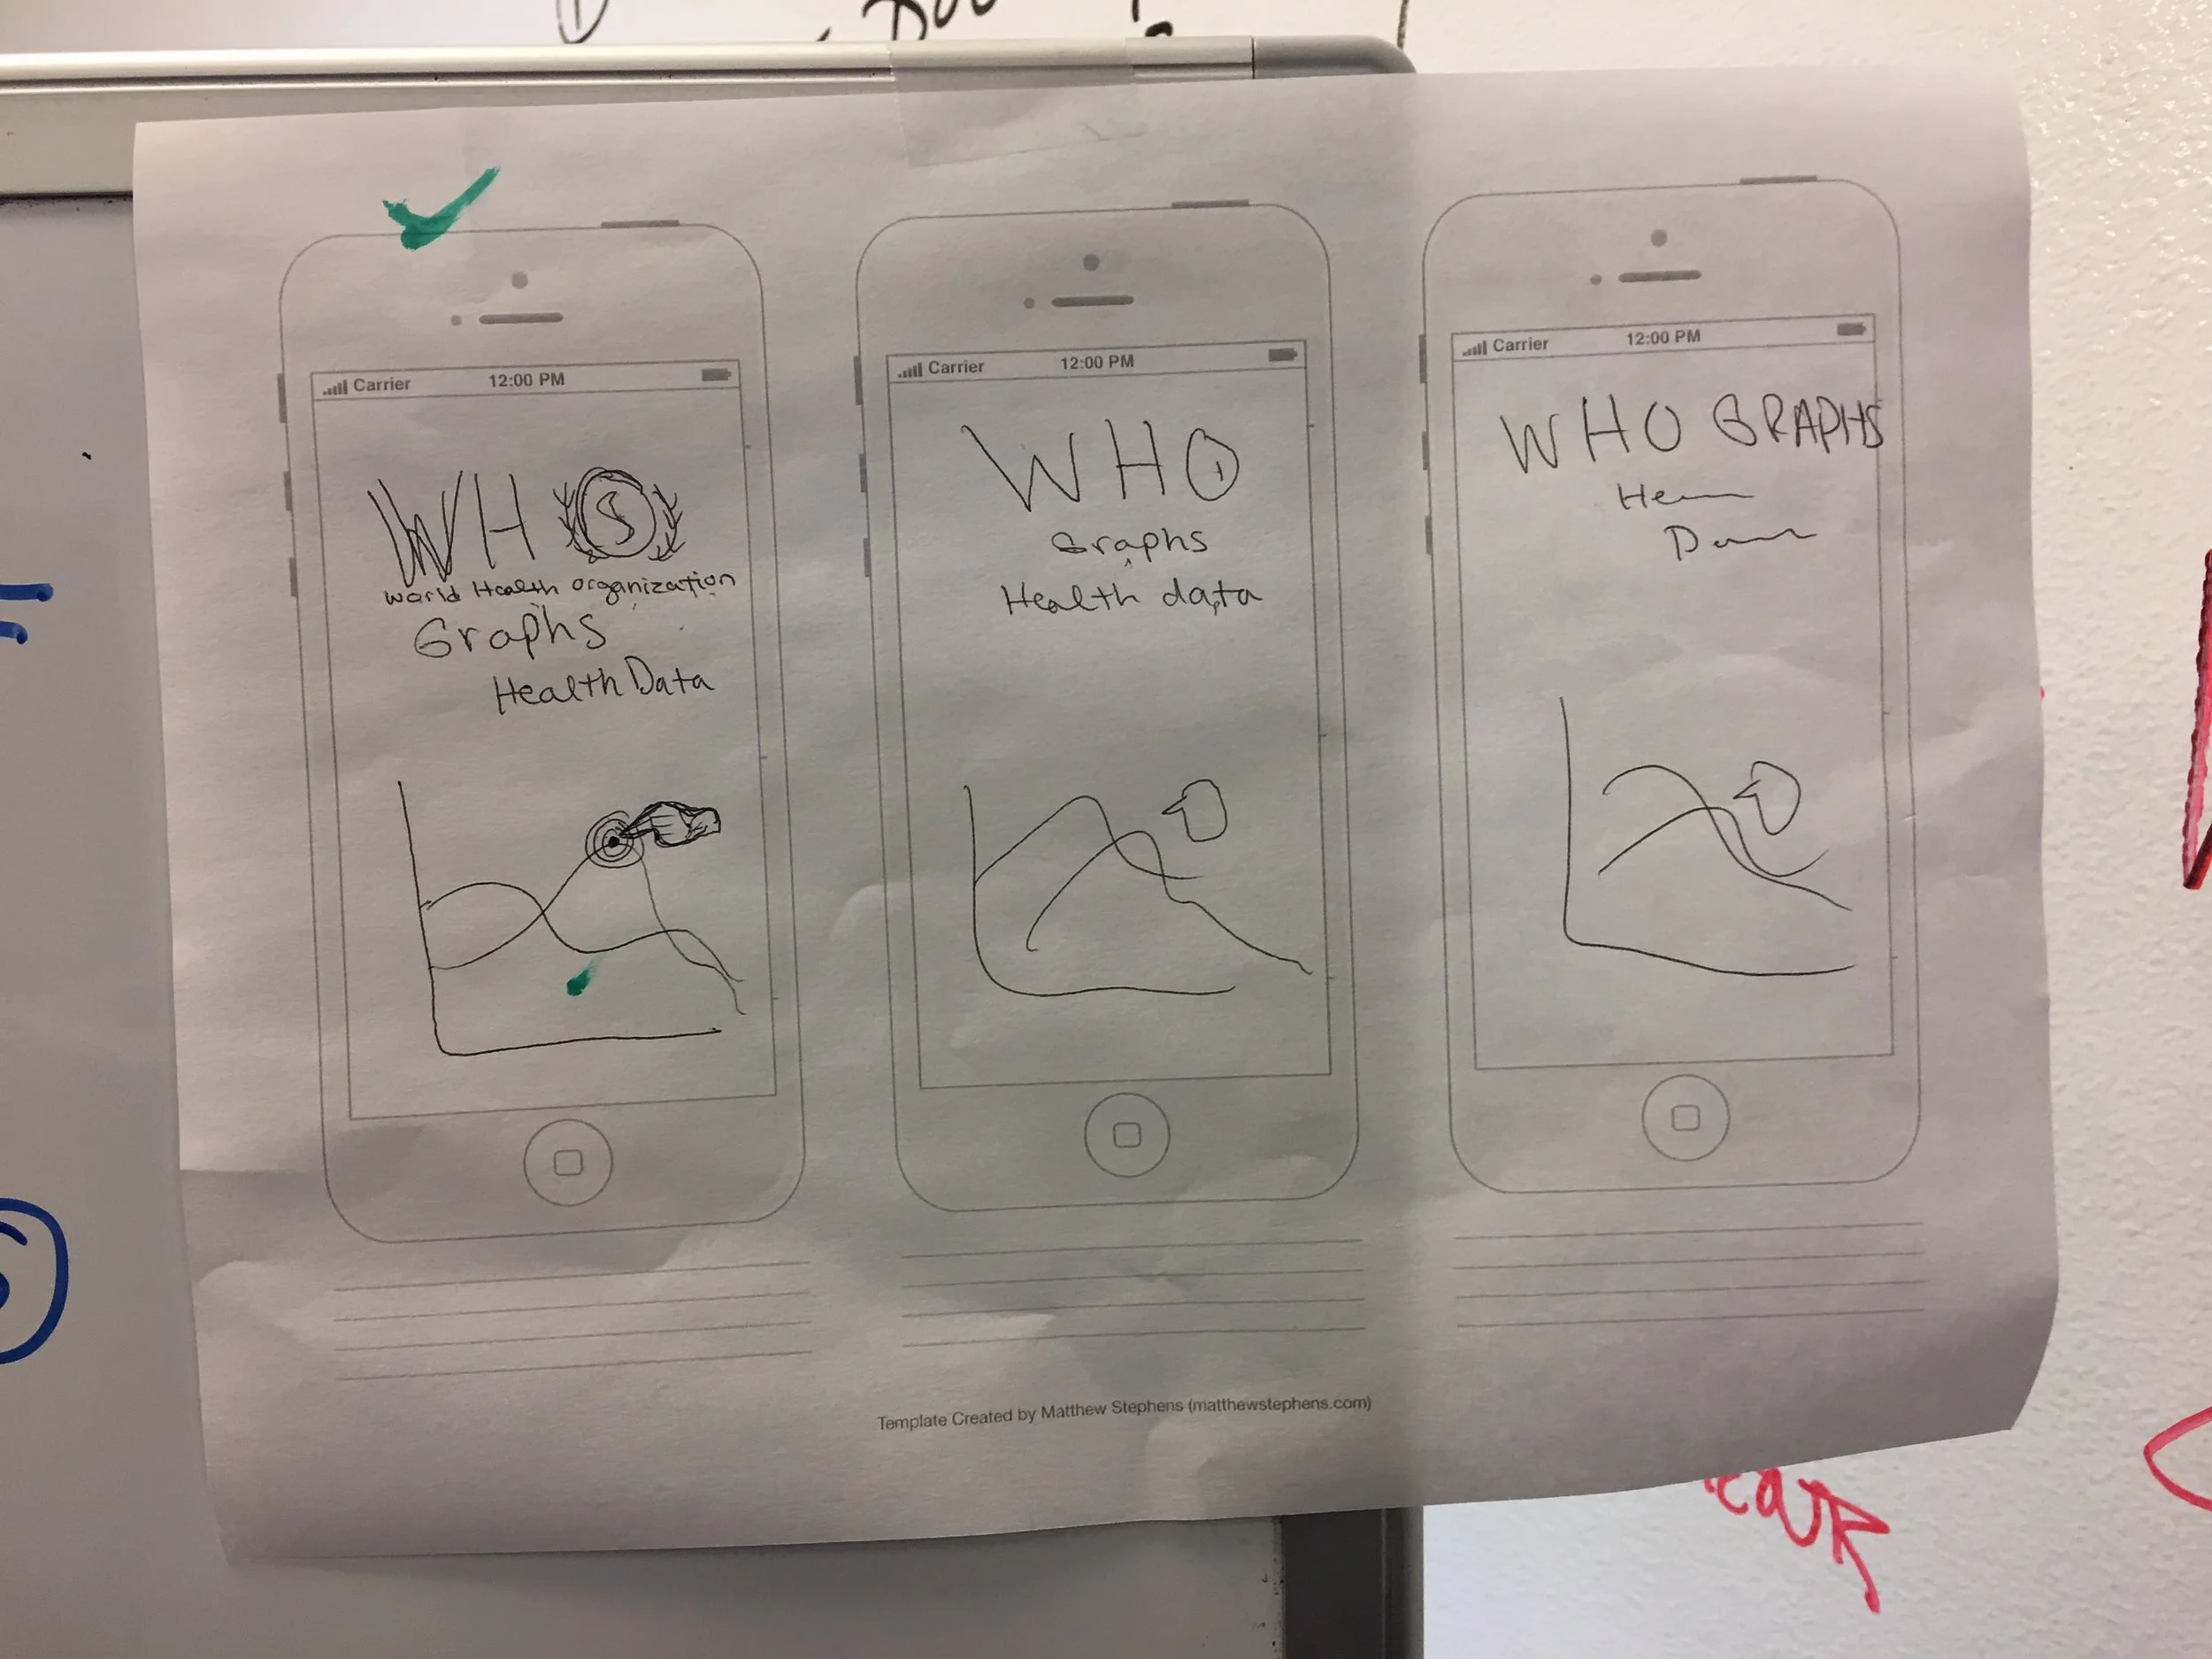
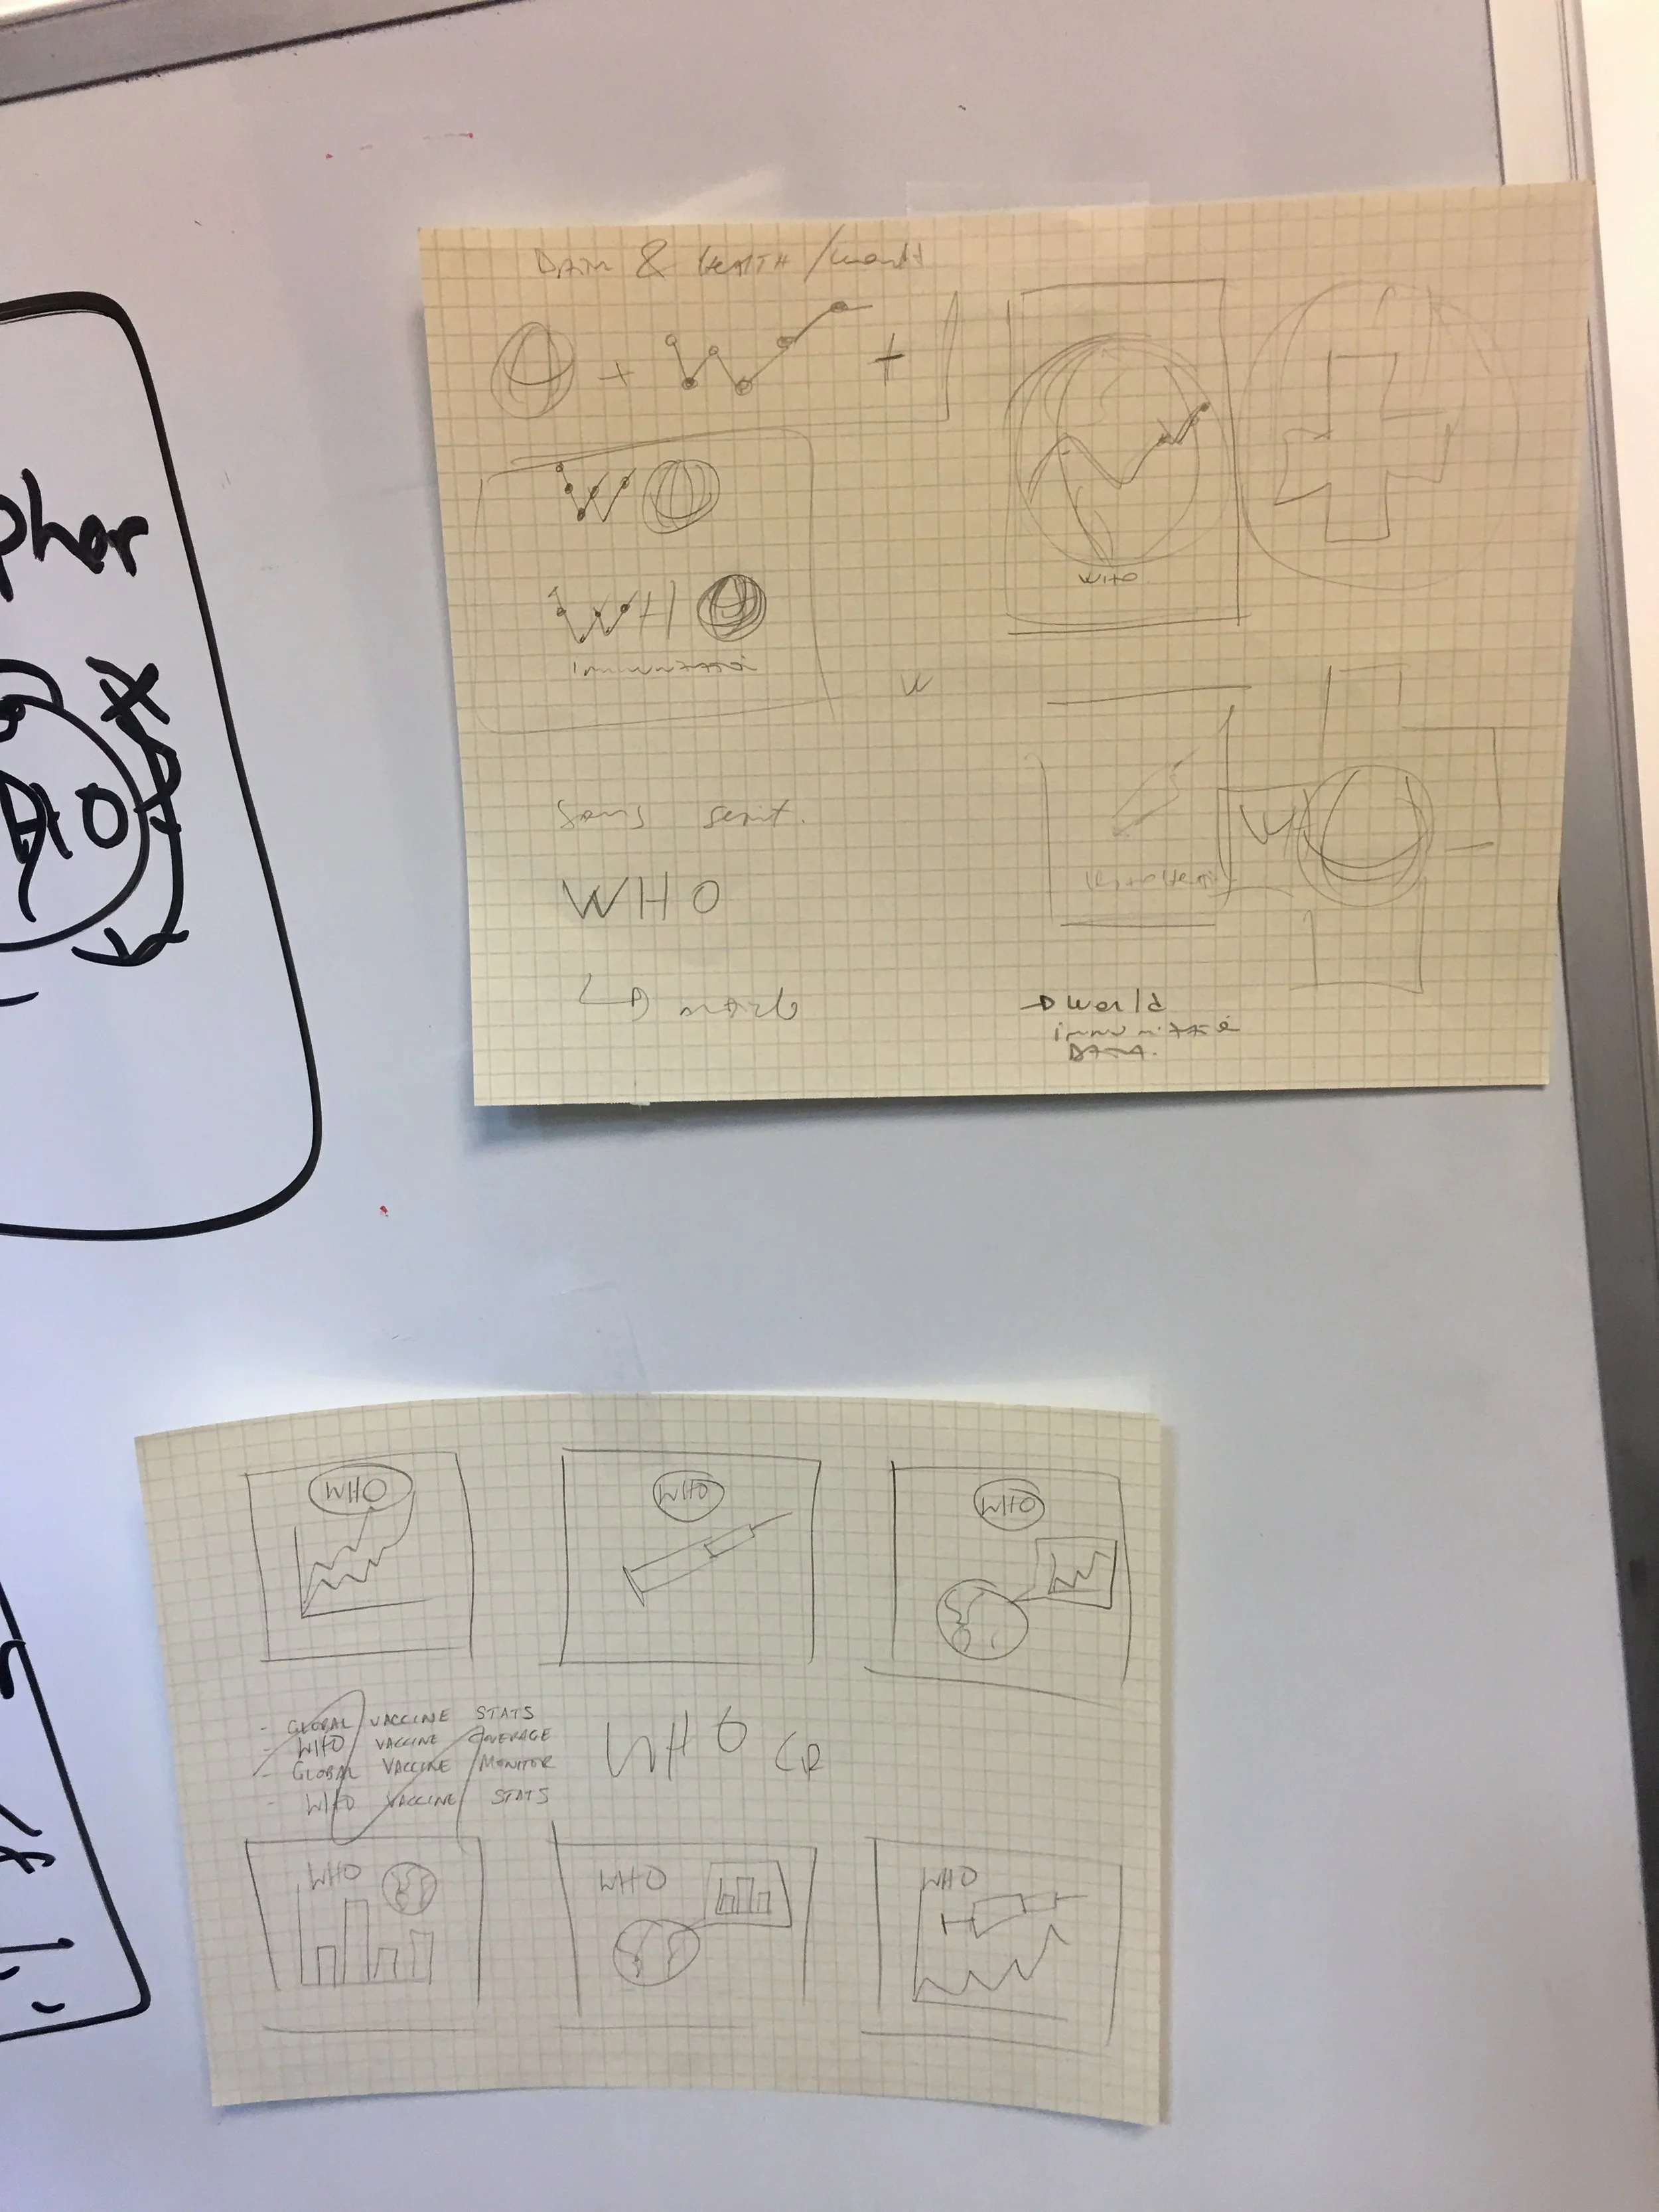
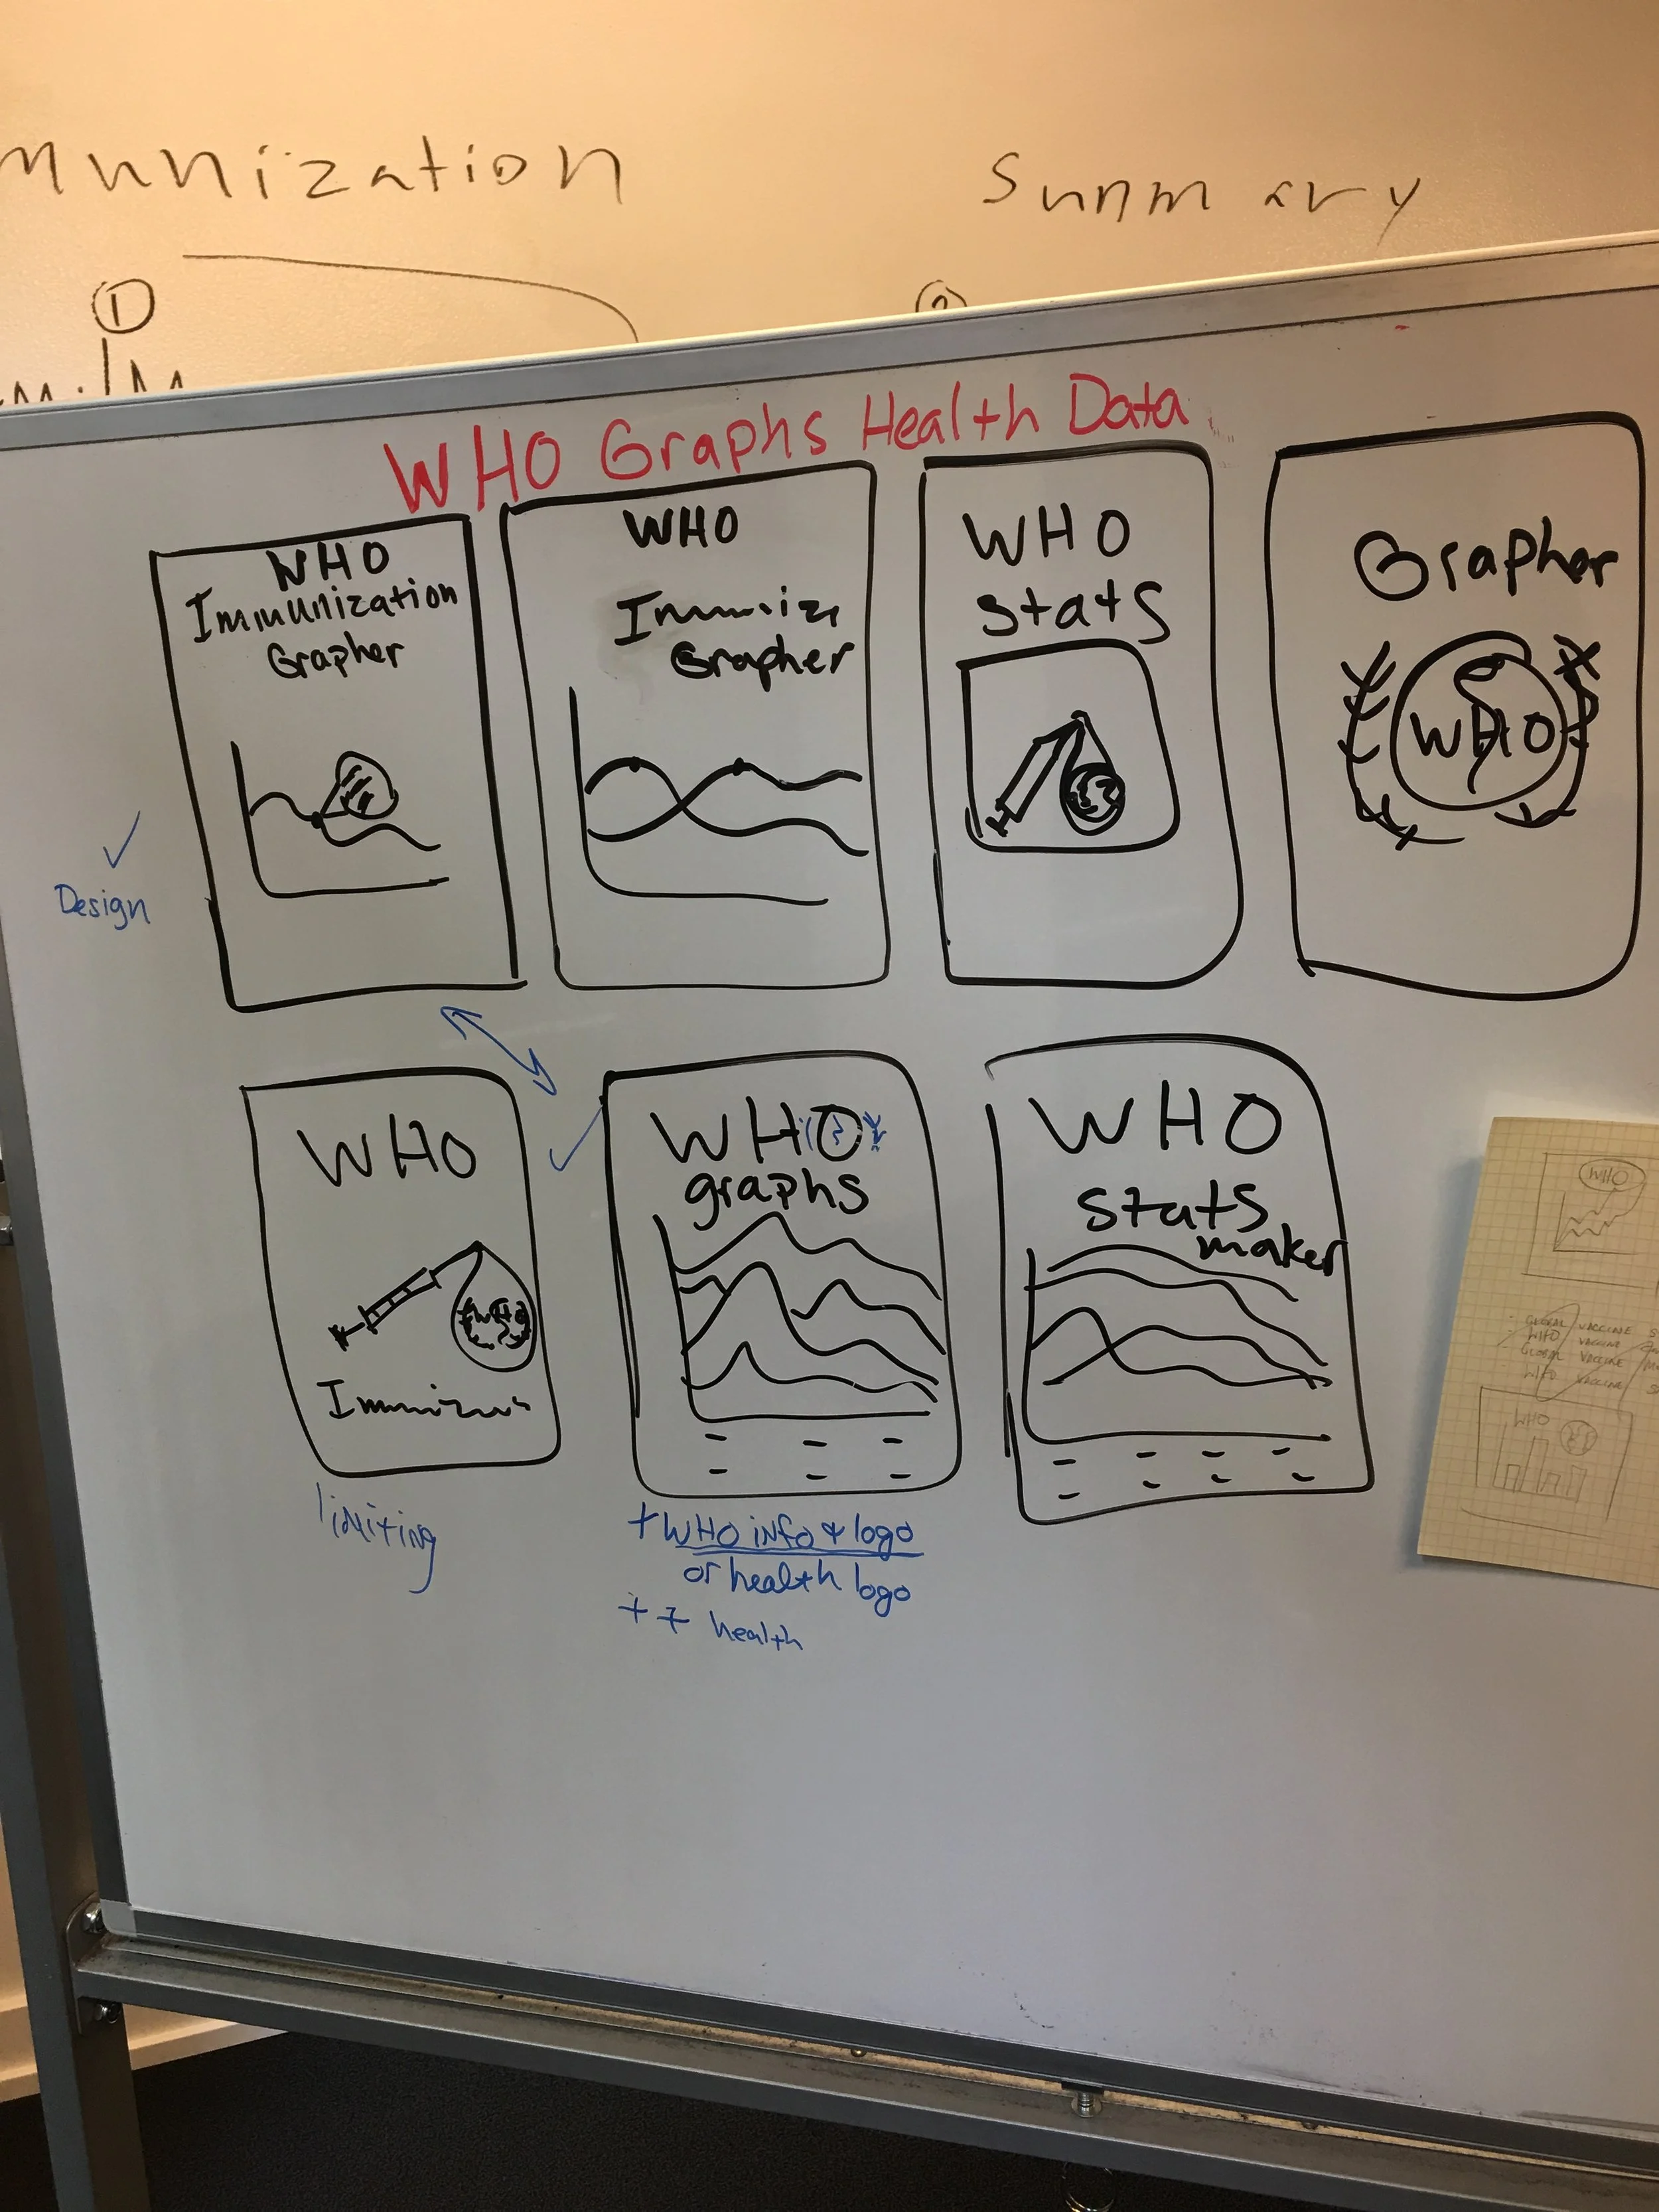
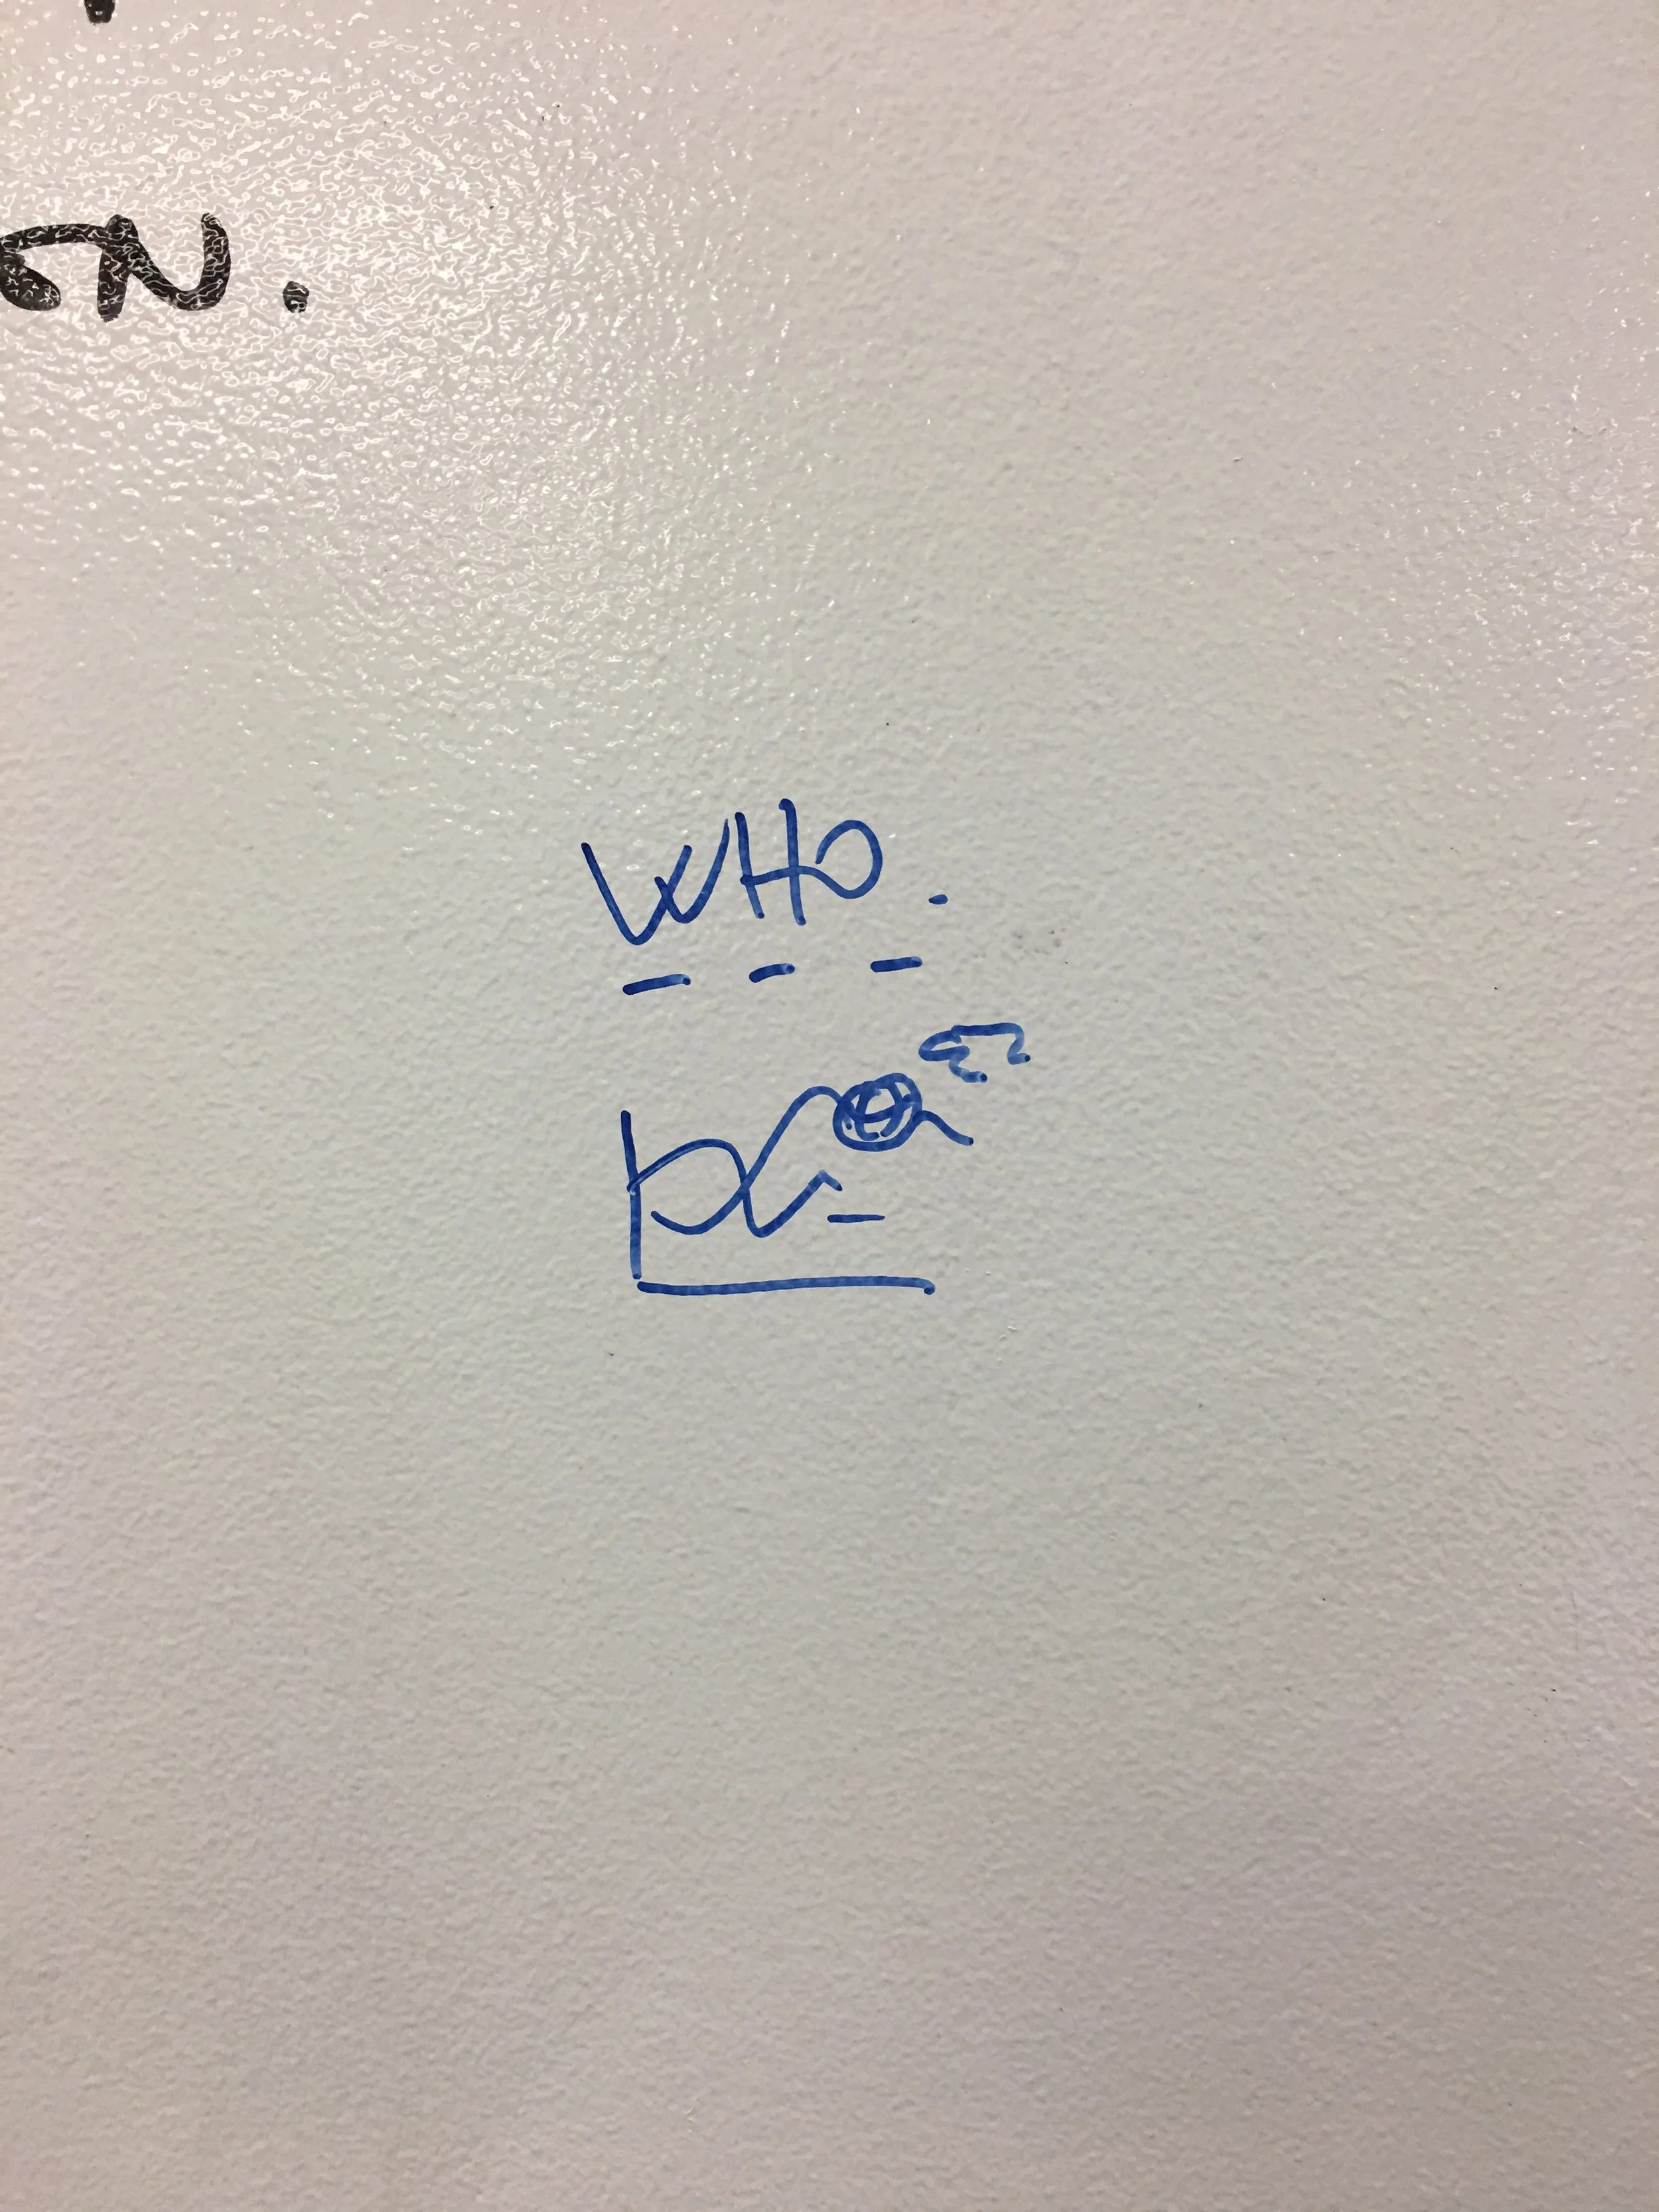
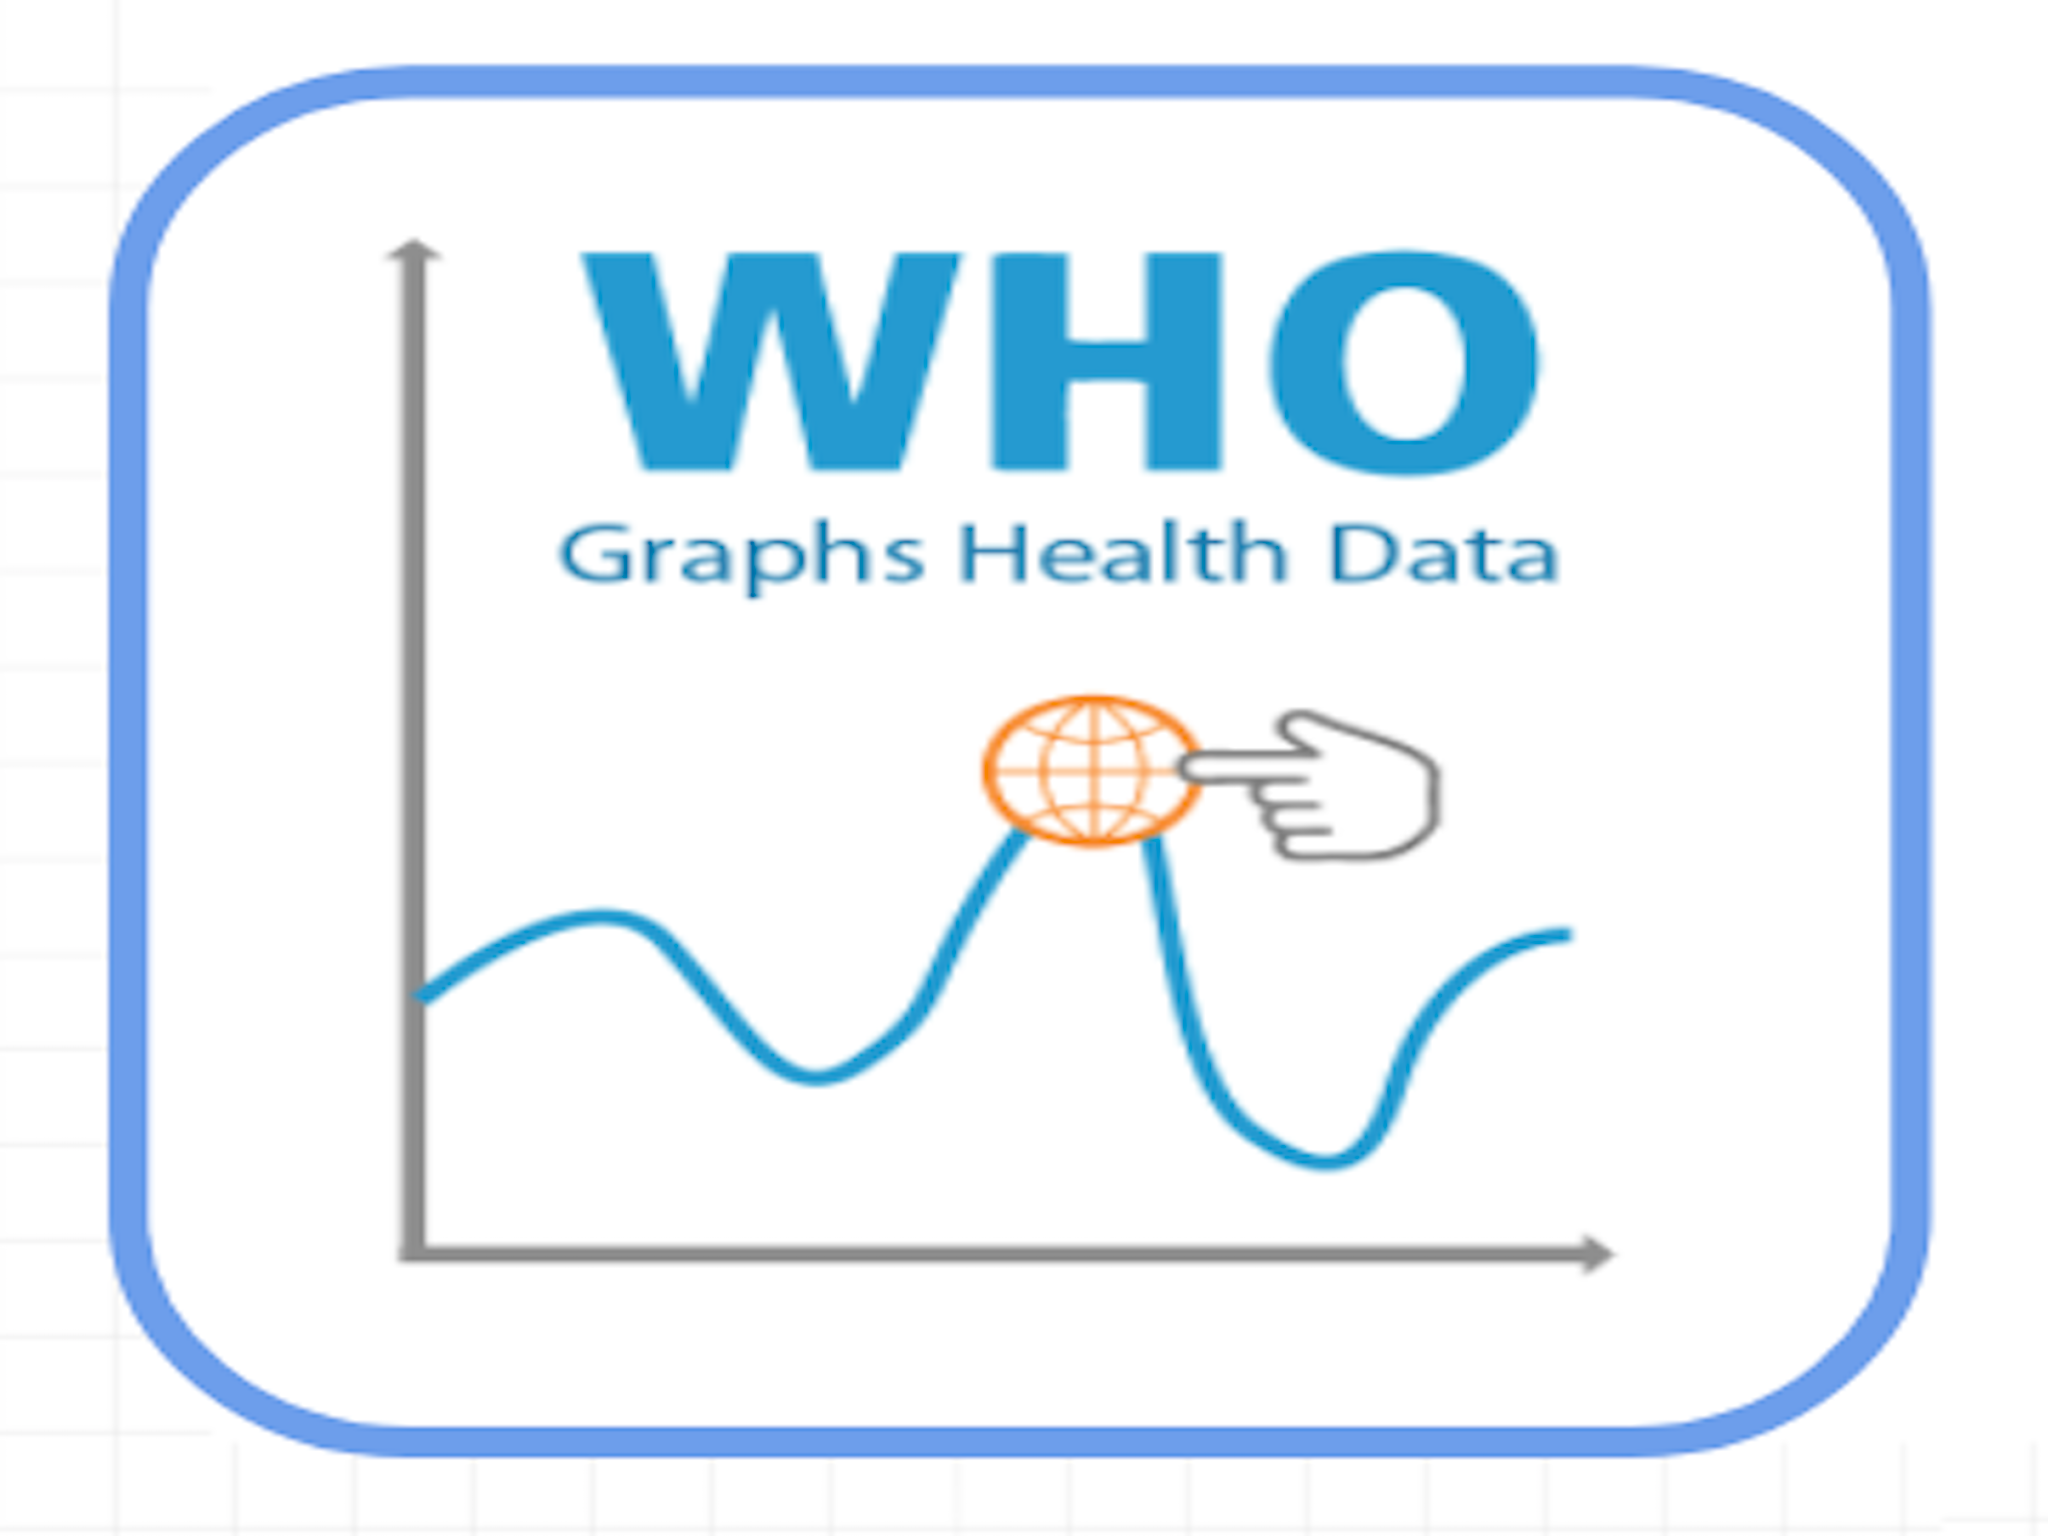
The new icon was taken from my sketch contributions as seen in black whiteboard marker above.
The new name clearly relays the app’s new functionality. The title also reads as a ‘play on words’, relating to the World Health Organization‘s brand. Future iterations of this icon might include placing “Health Data” onto a separate line; making the play on words is less prominent, allowing “Health Data” to read as more of a by-line to “WHO Graphs”.
testing
Based on research, it was determined this app would best serve two primary user personas:
User 1
A medical research professional/community outreach worker
Using the app as part of regular educational outreach.
User 2
A Learner and /or Instructor
This user would have temporary interaction with the app for a lesson or assignment.
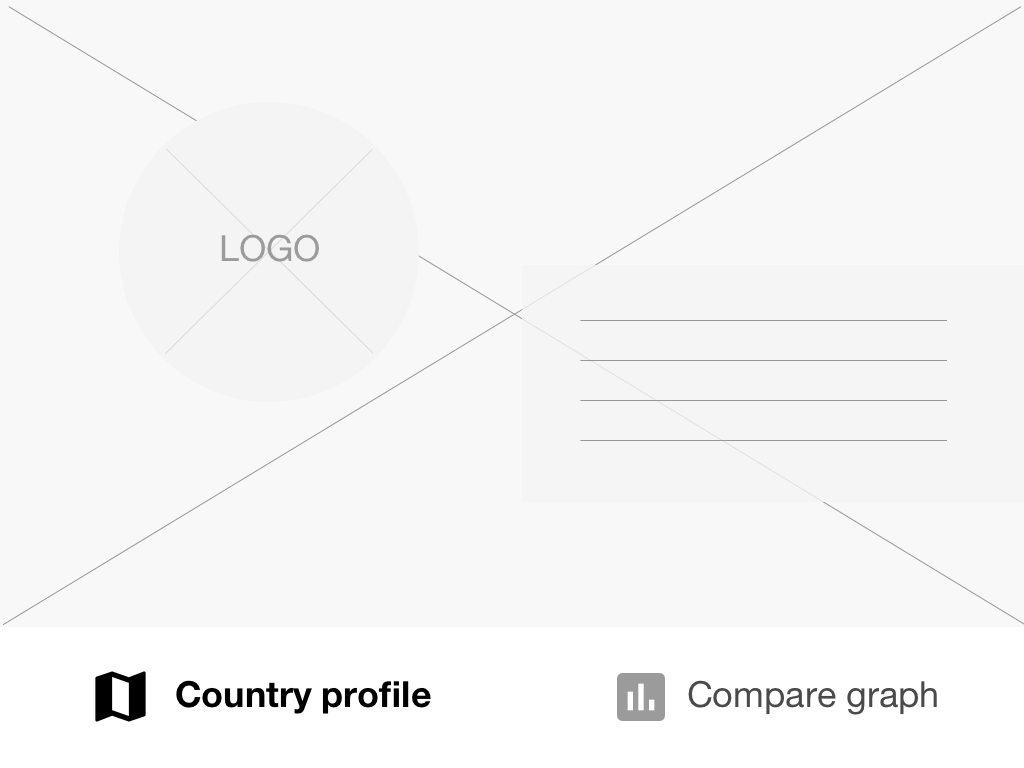
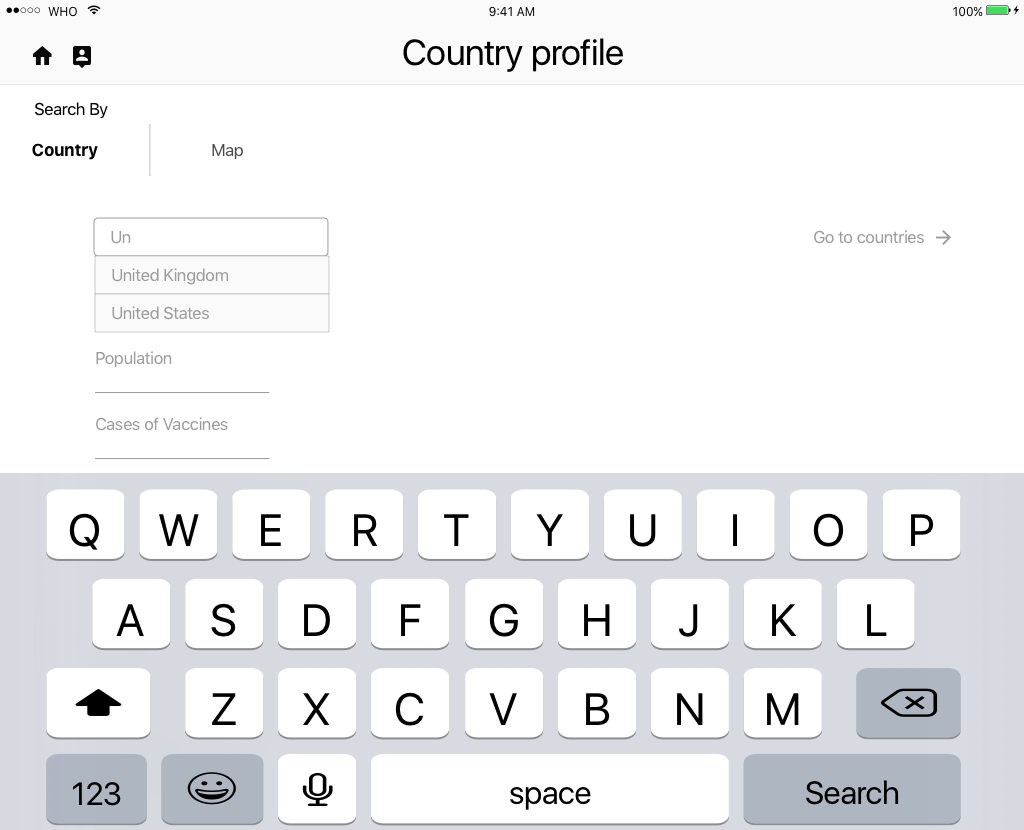
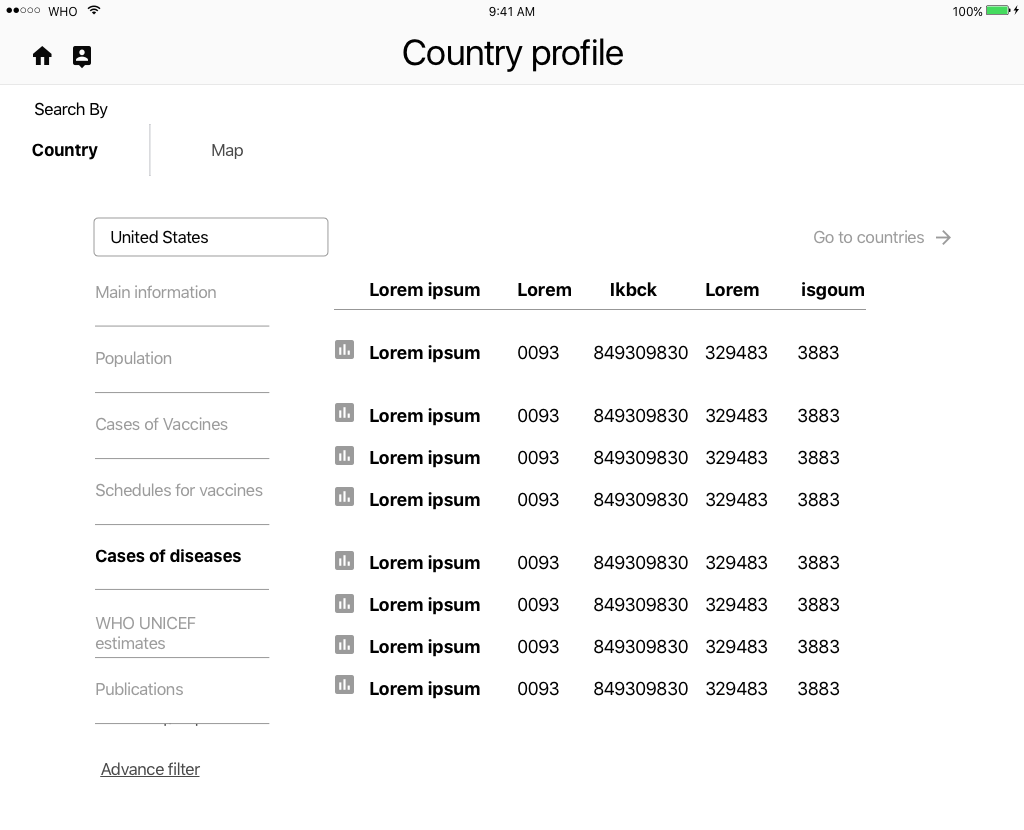
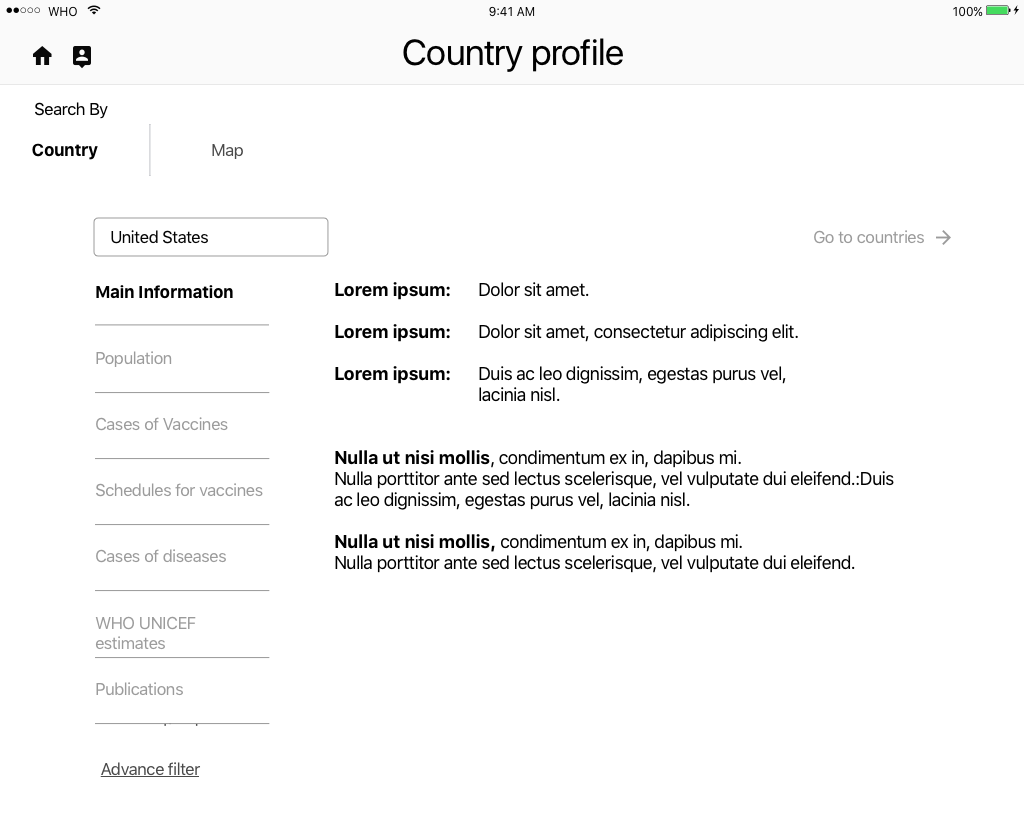
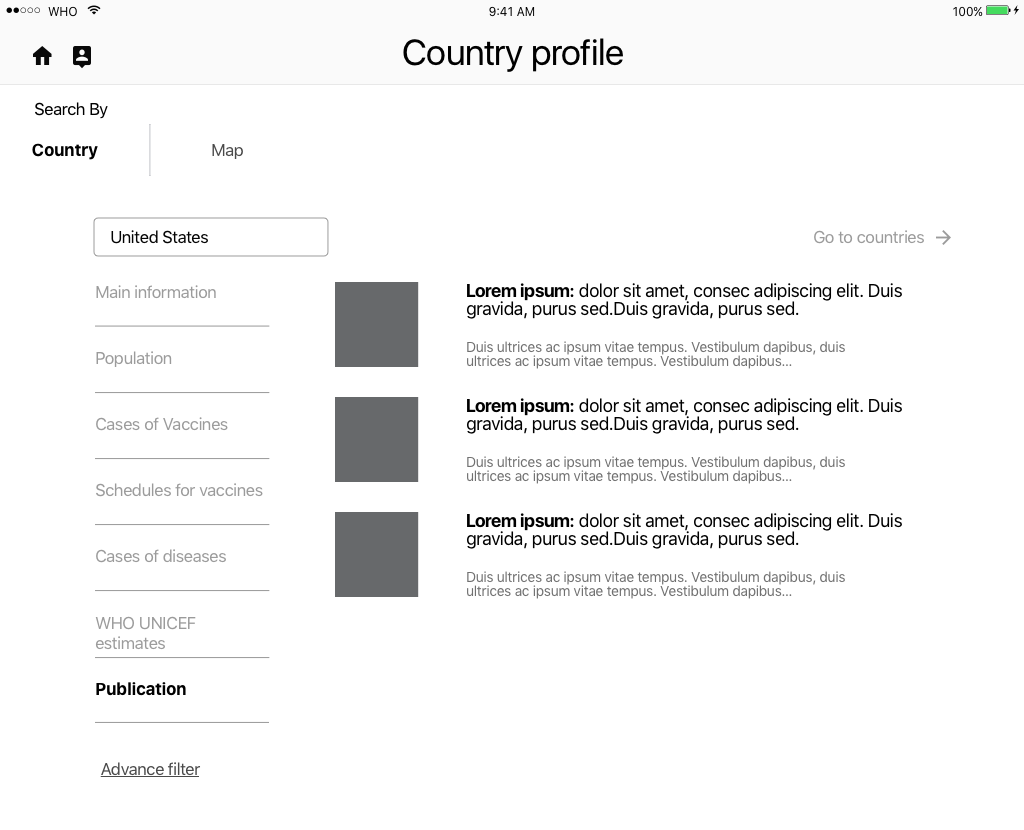
An initial low-fi prototype was used to test the user flow of the new navigation using Invision.
Scenario 1
The primary persona (user 1) uses the app for educational purposes.
She demonstrates the app function for the children, then allows them to work in the app on their own devices to compare data and visualize health trends; driving home the importance of vaccinations.
Scenario 2
The secondary persona, (user 2) is the student and novice user in terms of reading graphic data.
The student views the demonstration of the graphing
function of the app, and is then invited to add their own information to produce a comparative, or new graph.
Low-fi prototype page views
iterations
Changes were made to the UI and a hi-fi prototype created to measure the functionality of the new app layout and navigation based on my information architecture and new interactive graph features.
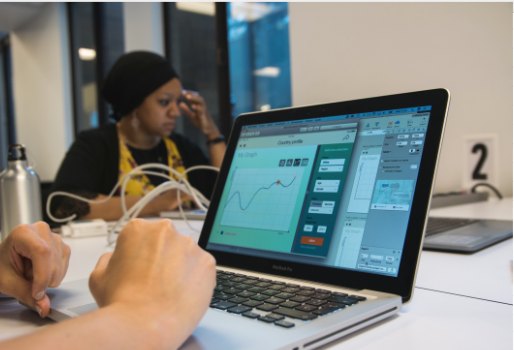
The app was improved by satisfying both the user and business needs. Through insightful rearrangement of the app's architecture, the final product made the available health data easy to access, interactive, visually appealing, and educational.
project Management
Organization
My team agreement included an open communication strategy that focused on reaching out immediately for help and addressing any potential misunderstandings directly and in the moment. As tasks arose that spoke to a strength of one of my team members, I supported them as they took on the goal. We had daily standup meetings and I kept track of our daily progress using a Trello® board. We also used Google Docs and Calendar to communicate, share work, and set our daily goals.
Team Dynamic
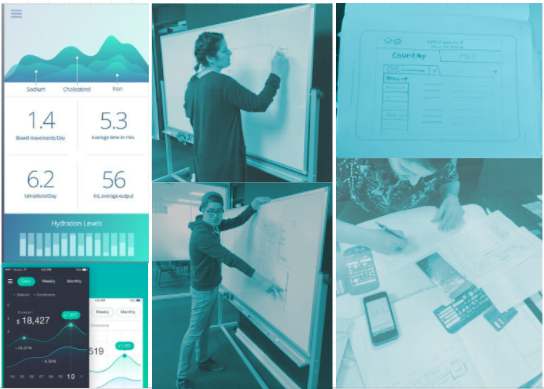
When it came to differences of opinion on features, we agreed to refer to our business needs and user needs as a guide. If the item up for debate met both criteria, we would then move on to testing.
User testing was the most effective tool, as it reveals the prefered choice after just a few test users.
next steps
recommendations
Conduct followup research with primary users
More testing of existing app features
New features - primary user feedback & literature search
Analytics - regressions, confidence intervals, etc.
Risk estimates & statistics - odds ratios, etc.
Further stratification of indicators - countries into cities, years into months, population into more demographics
Hindsights
grow
Create a system for keeping file assets organized.
glow
Finding a successful solution to a very difficult problem, and hacking communication challenges.
lessons
1. Not every app on the market is optimized for the mobile experience.
Just because it is available for download does not mean it is optimized for mobility.
2. Great things come from collaboration.
As designers, we all have very strong opinions and points of view. Our work however, is primarily collaborative, making strong communication skills an asset. By keeping the business and user goals as the focus, along with a solid communication strategy, things went smoothly and produced a great final product.
3. It takes constant monitoring to keep a project on track.
I learned a lot about keeping a project on-task through a challenging timeline. Tasks sometimes take much longer than expected. It’s important to remember to build in time cushions for tasks in preparation for the unexpected. Most importantly, I learned how to avoid those rocks along the path that can potentially trip up a project.
~end~

Smile Partners
Nonprofit Website Redesign
A Case Study
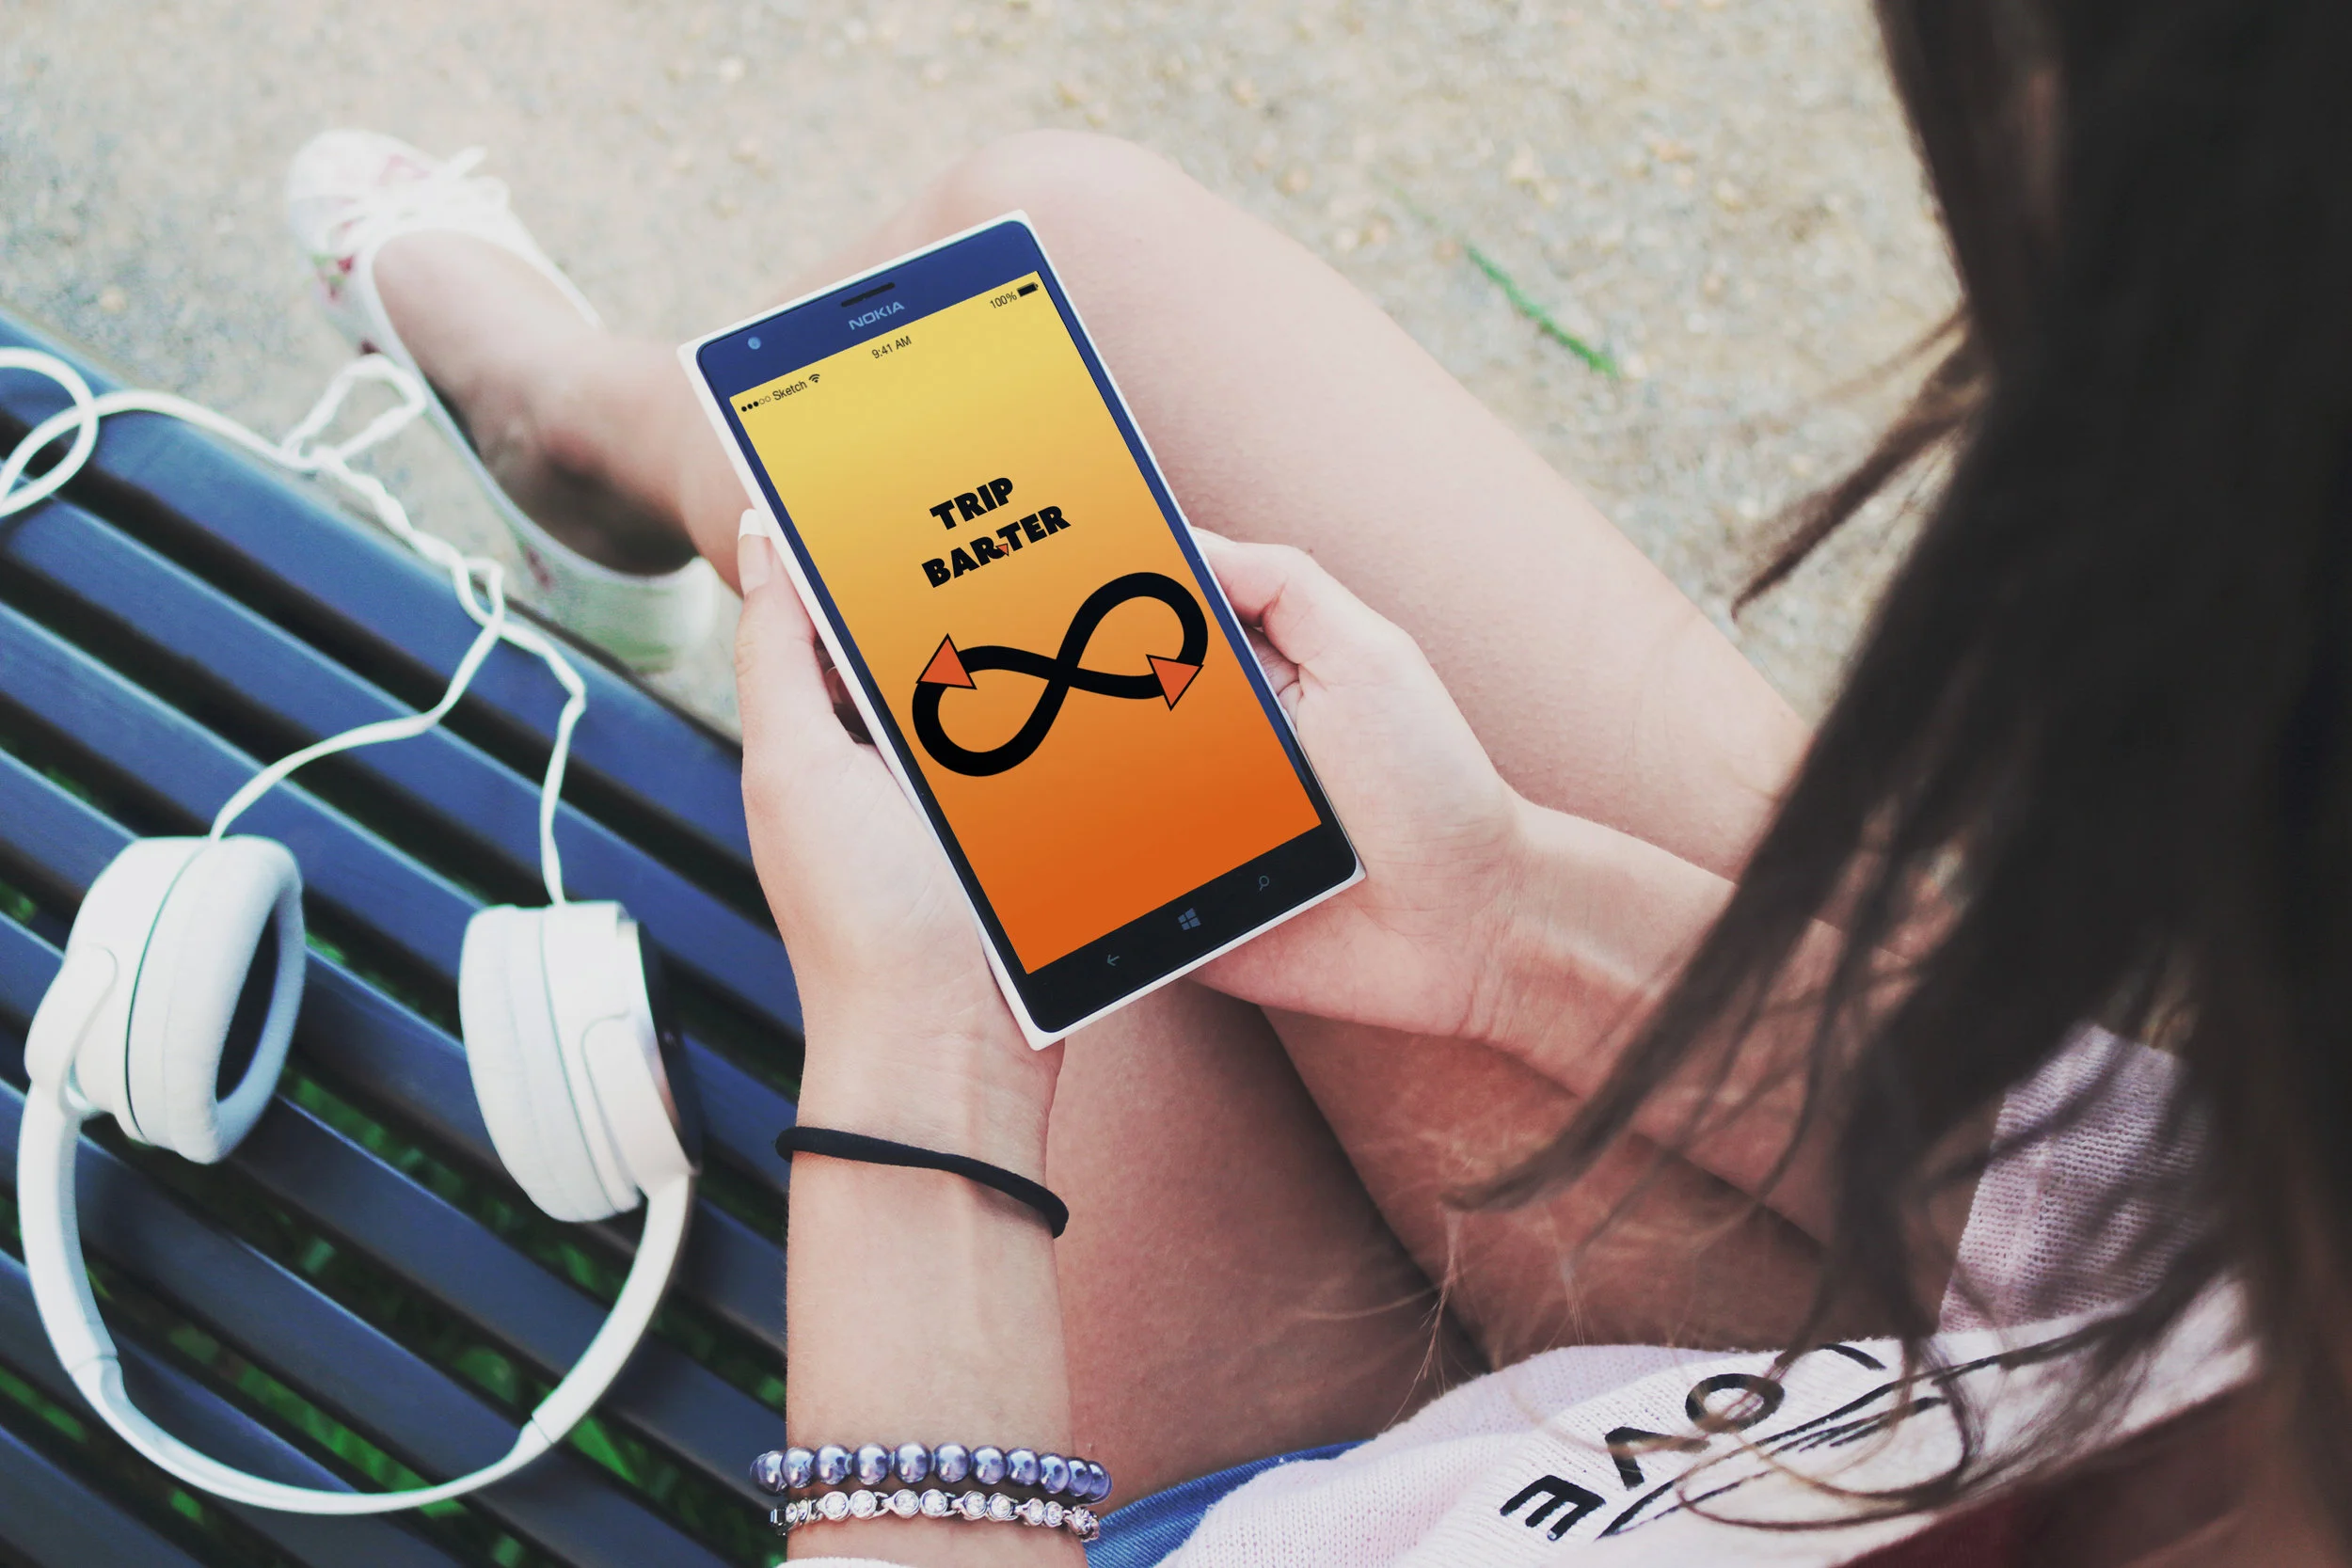
Trip Barter
Carpool Meets Bartering App
A Case Study